Posts

Showing posts with the label Stocks

Forrester Research (FORR)

Image
Forrester Research Inc. ( FORR ) featured in my newsletter [ $ ] as a stock testing triangle support at the 200-day MA. A couple of days after it's initial feature the stock created a bullish hammer at triangle support. What followed was a steady rise to resistance, with the breakout completing earlier this week on the back of earnings . Yesterday followed with a successful backtest of $28.35 support. The point-n-figure chart fell a penny shy of a triple top breakout, with a current upside target of $43. Get the Fallond Newsletter Trade my Stock Picks at

Exponent (EXPO)

Image
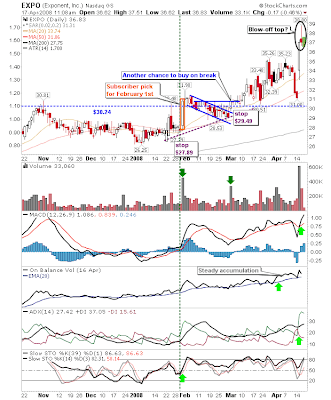
I had featured Exponent ( EXPO ) in early March . The past three days have created what looks to be a short term blow-off top and is reason enough to take some money off the table. Up 20% from March. Trade my Stock Picks at

Google Stock Screen

Image
I took the Google Stock Screener for a test drive. It's got a very plain, simple interface compared to that of MSN's Advanced screener, but lacks some of MSN's (excellent) functionality. One thing I do like about Google's is that there is a neat graphic showing the distribution of stocks across the various parameter settings. I wanted to look for stocks which were showing discounts in dividend yield. I like to be getting something back from the stock while I hold for the long term so screening using yield as a filter is a good place to start. The idea is to buy 'decent' stocks to take advantage of oversold market breath indicators when such stocks should be trading at a 'discount'. I'm not looking for the next high flyer as momentum plays tend to emerge 1-2 months after a bottom is in place and markets still appear to be feeling for that bottom. This is a scan more suited to the retirement account where capital loss tax write-offs aren't an opti

JAKKS Pacific

Image
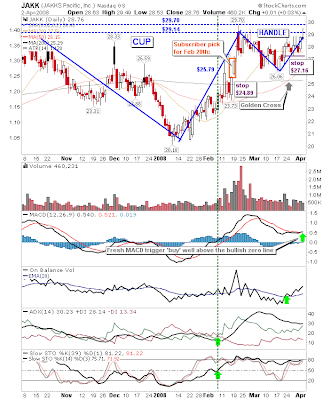
JAKKS Pacific ( JAKK ) was a featured newsletter pick for February 20th [ $ ] . The stock since shaped a solid looking cup-and-handle pattern with rising accumulation on the back of a fresh MACD trigger 'buy' (well above the bullish zero line). The original stop of $24.89 can be raised to about $27.16, although those looking to allow a little more room can allow for a stop just below the lows of the handle at $26. The push to $29 was enough to trigger a Triple Top Breakout on February 21st in the point-n-figure chart which reversed the previously bearish target of $13 to the bullish $46. A projected base target is closer to $42. On the Options side, January 09 $15 strikes trade from $14.80 from the Ask, although there is not much in the way of open interest. Trade my Stock Picks at

Tech watch

Image
With the indices struggling to break through their 20-day MAs, let alone the 50-day MAs, there are signs of a recovery in some leading Tech stocks . Sample list: GOOG , AAPL , CSCO , BIDU , MSFT , INTC , ORCL , AMAT , TXN , HPQ Stocks above 20-day MA ( 80% ): Apple ( AAPL ), Cisco ( CSCO ), Baidu ( BIDU ), Microsoft ( MSFT ), Intel ( INTC ), Oracle ( ORCL ), Applied Material ( AMAT ), Hewlett Packard ( HPQ ) Stocks above 50-day MA ( 40% ): Cisco ( CSCO ), Intel ( INTC ), Applied Materials ( AMAT ), Hewlett-Packard ( HPQ ) Stocks with a 20-day MA > 50-day MA ( 20% ): Applied Materials ( AMAT ), Hewlett-Packard ( HPQ ) Not the worst spread of strength for a weak market. Of the two intermediate bull trenders ( AMAT and HPQ ), Applied Materials ( AMAT ) has the best outlook going forward. Hewlett-Packard is struggling to hold its 200-day MA/40-week MA after 3 years of strength, so I would can this as a long side play (or maybe consider a January $70 2010 put going for $23.60 from the a

Exponent (EXPO)

Image
Exponent ( EXPO ) originally featured as a subscriber pick for February 1st [ $ ] . On Monday the stock cleared a bullish flag on higher volume. On Tuesday the stock stabilized around $30.75 resistance. So Wednesday could see the follow through from the bull flag breakout. This is a relatively illiquid stock, so building and exiting a large position would be difficult. The stock doesn't trade options and there was no company specific news to account for Monday's breakout. The point-n-figure chart is also unchanged from the original feature. As for a price target, I have stuck with my initial expectation [$] . Trade my Stock Picks at

Coeur D Alene Mines (CDE)

Image
Coeur D Alene Mines ( CDE ) had initially featured as a blog stock pick for December of last year. The Technical picture has improved considerably, although the gold miners have not enjoyed the same exponential growth as seen in base metal prices (this is bearish for the base metal as stocks lead commodities with respect to performance). Given there is a reasonable chance of a breakout failure one could use Monday's move as an opportunity to raise the stop for the December 'Buy'. The point-n-figure chart has a new price target of $9.25 from the December 17th target of $7.75. The chart is nicely set for a triple top breakout if it can make it to $5.50 (an additional 'Buy' trigger). On the options front the January 2009 $2.50 calls currently trade at $2.90 from the ask (up $0.85 from December), with the $5.00 calls at $1.20 (up $0.30 from December). Monday's gains came courtesy of earnings . Trade my Stock Picks at

Durban Roodeport Deep (DROOY)

Image
Durban Roodeport Deep ( DROOY ) has seen steady growth off the back of rising gold prices. The 20-day MA has proven itself to be a relatively good 'buy' point over the course of the last few months, but an alternative entry price could present itself if the mini-pennant covering the last 4 days breaks to the upside. The stock initially featured to newsletter Subscribers as a pick for January 25th [ $ ] after its bullish gap breakout. Existing holders could raise their stop to a trailing 1% break of the 20-day MA until it reaches my suggested target . Options players are out of luck on this one. The most recent PR was an upgrade from HSBC Securities on February 19th. Trade my Stock Picks at

Contango Oil and Gas Co, (MCF)

Image
Contango Oil and Gas (MCF) has featured a number of times in my stock pick section of the website. Tuesday's little jump above a tight consolidation is a good opportunity to raise the stop - if not add to a little more, or take a new position. I haven't raised my price target . The stock has been relatively news shy of late, with quarterly earnings already out of the bag. Trade my Stock Picks at

Top 3 Dividend Stocks

Image
I ran a quick scan for dividend paying stocks on MSN Screener with the following parameters: Current Dividend Yield >= 5% Market Capitalization >= 100,000,000 Div Yield: 5-year average >= 5% EPS growth YTD vs YTD >= 25% EPS growth Qtr vs Qtr >= 15% Return on Equity >= 17% The screener returned eleven stocks; best of the bunch were [1] Terra Nitrogen Co. LP ( TNH ): This has the added advantage of belonging to Agricultural Chemicals, ranked strongest sector according to Barchart.com . The weekly chart is looking tired with falling volume on new highs combined with a bearish divergence in the MACD trigger line. Should the stock trade inside a $72-$126 range it would be an attractive dollar-cost-average candidate. Those looking to pick a single entry price should look to the Fibonacci levels: $103.71, $106.66, $114.92 and/or the 50-day MA. Re-invest the somewhat erratic dividend and this could be a great long term hold as commodities (and their associated stocks) t

Bullish divergences at play as Tuesday's gap breakdowns tempt....

Image
There is one stock for today, Contango Oil and Gas ( MCF ) available in the free section of my main website and made available to readers of my newsletter. As for the markets it is still a waiting game to close last Tuesday's gap breakdowns, although the 20-day MAs are likely to get in the way first. As a sidenote, there is an interesting divergence at play in the Percentage of Stocks above the 50-day MAs. When the market bottomed in January only 15% of Nasdaq stocks were above their 50-day MA. This rose to 26% as the market made a new closing low for February. This divergence is further supported by the bullish divergences in the Ultimate Oscillator and MACD trigger line. Also look at how a negative divergence played out during the October top. Trade my Stock Picks at

Advanced Battery (GBT)

Image
Advanced Battery ( GBT ) has traded itself into a tight range, bound by its 200-day MA and 20-day/50-day MAs. The suggested play is to buy a break of the latter averages (c$4.33) with a stop on a break of its 200-day MA ($4.02). Technicals have flattened and don't give an immediate 'tell' as to which way the stock will go, but this flattening also precedes sharp moves. A break of the 200-day MA could see a retest of November lows at $3.26 (an alternative short play?). The most recent news was the $23m contract to make electric batteries for bicycles and motorcycles which saw the stock jump to $4.65; so if you like that news you should like it more here! If anyone is willing to trade these picks (and others) in the Stock Exchange game (linked below the chart) let me know. I will give such participants free membership to this site on the condition they trade only the stocks I provide. Trade my Stock Picks at

Star Scientific (STSI)

Image
Star Scientific ( STSI ) has little in the way of news to drive price action, but the stock is nicely placed following Friday's positive test of Support. The stock featured to Subscribers for January 15th [ $ ] at $1.15 and again for January 25th [ $ ] at $1.49 . January 17th saw a triple top breakout on the point-n-figure chart with a price target of $3.75; a move to the huge red candlestick from early 2007 is a potential upside target. Technicals remain firm with strong gains in the MACD trigger line under steady accumulation by on-balance-volume. Support runs in a band between $1.40-$1.45 - stops can go 1% below this level (or thereabouts). Trade my Stock Picks at

Buyers range established

Image
The last two days have seen tweezer bottoms in large cap indices, a bullish piercing pattern in the Nasdaq 100 , and a (somewhat) bullish engulfing pattern in the Nasdaq . But my favorite, the semicondutor index , refused to buckle in the face of broad market selling over the last week - although it would be hard pushed to shed more than it has already. Wednesday's bullish hammer is the icing on the cake. Watch for a fresh MACD trigger 'buy' (but well below the bullish zero line, a weak signal) as other technicals improve: The Semiconductor index has a Point-n-Figure chart target of 260 (which would amount to a 50%+ decline from its 2007 highs!). To negate this target the index would need to muster an upside breakout, with 364 likely to define such a threshold. The technology sector is one of the first to push higher from a recessionary environment. Chips should lead other technology based sectors. For the purpose of disclosure I am long some deep-in-the-money calls on the

Cosan (CZZ)

Image
This featured as a member [$] pick last week. The stock continues to provide solid bullish action with Thursday's and Friday's action confirming $13.36 as support. The original stop from $12.79 can be raised to around $13.29. As a 2007 IPO the stock has no overhead resistance, so it is well placed to move higher from here. The stock has listed options , but not the liquidity to make them worthwhile.

Gap (GPS)

Image
Maybe not the first name to jump out of box, but this old dog (it has been caught in a trading range since 2004) might be about to learn a new trick. The chart shows a steadily rising price trend helped by the recent 'Golden Cross' between the 200-day and 50-day MAs. The past two days have seen some demand at the 200-day MA as indicated by the long, lower tail candlestick shadows - one of which also finished as a 'dragonfly doji'. Technicals are a bit of a mixed bag, but the accumulation trend in on-balance-volume is clear. There may be a concern with the break of the August-November trend, but using the 200-day MA or candlestick lows for stop placement will help define downward risk. Options ; short term traders will be looking to the 20-day MA as a target (currently at $20.80); but the $20 Jan strike at $0.50 from the ask looks expensive, with the $20 Feb strike at $0.90 only marginally better. Best short term play would be the $15 Jan strike at $4.50 ($0.15 time prem

Chart: Natural Resources IShares (IGE)

Image
Decent breakout from a cup-and-handle pattern. Measured move target is around $150, but the point-n-figure chart of $164 is not an unreasonable secondary target. Risk easily defined by short term lows

Archive

Show more