Posts

Showing posts with the label Sentiment

Bullish Percents getting a little toasty

Image
Although not of immediate concern, some of the bullish percents are about to enter bear market (but not bull market) top territory. If January lows represent the start of a bear market then these breadth indicators should top soon. If the current rally is a continuation of the cyclical bull market then there is room for another 15-20% of gain (perhaps as much as 50% for the Nasdaq Bullish Percents). How this impacts on the market remains to be seen, but the likely outcome would be a negative divergence between breadth indicators and the market; indices make new highs as bullish percents fall. Time will tell. I'm traveling to D.C. so there will be no update tomorrow. INS appointment Friday. Get the Fallond Newsletter

Modest weakness in Bullish Percents

Image
There is a sense things are getting a little toppy in the Bullish Percents. The S&P Bullish Percents have moved to a 'Sell' trigger at a resistance level marked by December highs. Unlike December, the S&P is above its 50-day MA, so it may simply be a blip on the road to higher levels. But it is a warning sign: Bullish Percents for the Dow and Nasdaq were flat and haven't yet marked future weakness.

Nasdaq 200-day MA vs 50-day MAs

Image
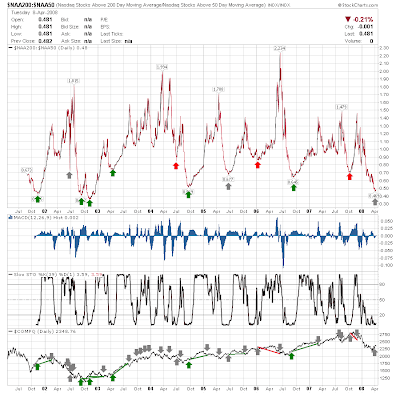
The relationship between the number of stocks trading above the 200-day and 50-day MAs describes the internal health of an index. It is not an ideal indicator, with obvious spikes not necessarily correlating to inflections in the market. This is especially true for spike highs where the number of stocks trading above the 200-day MA is greater the number above the 50-day MA - a situation associated with an overbought market. It is not uncommon to see such spikes occur during a well established decline (and in the case of 2002 spike highs, near the end of the decline). The ratio smooths into a more rounded bottom when the number of stocks above the 50-day MA is greater than the number above the 200-day MA. This situation is a little more helpful in pin-pointing bottoms, especially when the ratio shows twice as many stocks above the 50-day MA than 200-day MA (i.e. a ratio of 0.50 or less). Currently there are just over twice as many Nasdaq stocks above their 50-day MA than 200-day MA (0.4

Market Breakout

Image
Kevin over at Kevin's Market Blog said it best on his Dow Theory watch; Dow followed Transports higher. While the Semiconductors did their bit to support the Nasdaq 100 with a breakout of their own: But there is the question as to what volatility (and fear) will do now there is a test of the 200-day MA? Will profit takers emerge? Or will the 200-day MA turn from support into resistance, thus supporting a more substantial rally than previous corrections in this indicator have given?

Transports manage successful back test

Image
Monday's quiet trading did turn up one key positive; the back test of former resistance-turned support of the Dow Jones Transportation Average ( $TRAN ). The move was accompanied with a bullish hammer on higher volume, giving two more ticks in the bull column. Stochastics are on a 'sell' from overbought levels, so it could take a test of the 50-day MA to work a more solid bounce and reset stochastics. This strength should reflect itself in the Dow index with a break of January-April resistance. Positive money flow suggests accumulation: Can the semiconductor index be a proxy for the Tech averages? The semiconductor index is loitering around its 50-day MA having traded sideways since January. The relative difference between the 50-day and 200-day MAs has narrowed from its max 20% deficit suggesting the worst is behind this index. But unlike the Nasdaq 100, it has failed to break past its 50-day MA. Technicals are neutral-to-bearish so there is little indication that it cou

Bullish Percents sing from the same hymn sheet

Image
Yesterday's losses weren't enough to prevent a bullish cross of the 5-day EMA for the Nasdaq Bullish Percents. This follows earlier crosses for the S&P and Dow bullish percents. What is clear from these charts are the bullish divergences between January and current lows for the bullish percents with respect to the parent indices. Basically, more stocks are on point-n-figure buy signals now than back in January, even with the indices making new lower closing lows. What is important going forward will be the need to break declining (closing) resistance initiated in January for the Dow, S&P and Nasdaq. The Nasdaq looks best placed to challenge, although the Dow is closest to the major moving averages (20-day and 50-day MAs). Thursday probably won't reveal too much going into the long weekend, but next week should be interesting.

Copper watch...

Image
Last Friday's Jobs Report send bearish ripples through the market, but the real news for February wasn't the jobs report, it was the breakout in copper prices. Many will cite weakness in the dollar as the cause for the surge in commodity prices but this is too simplistic an argument. The following chart shows copper prices priced with respect to the Euro index: Why copper? As a key industrial metal for technology stocks (semiconductors in particular) it is an important measure for early economic expansion. From October through to early February demand for the metal declined as economic conditions deteriorated. However, February saw the start of a recovery over and above a simple decline in weakness for the dollar. If the copper:euro ratio can crack past 2.68 I reckon any chance of a recession will go kaput and it will mark a firm bottom for the markets. Markets discount economic conditions by 6-9 months, so Friday's data was priced in long before it was reported. Breadth

New lows for the McClellan Oscillator

Image
Both the NYSE and Nasdaq McClellan Oscillator posted new all-time lows. I have annotated with black arrows the areas where lows at similar oscillator levels were signalled in the parent indices for the past 6 months. The indication is that this is a start of a zig-zag bottom before the rally can begin, although the indices are likely within 2% of a bottom. I suspect Tuesday will see an attempted rally before bears try and push it down again Wednesday. Futures are up as of 4.30am ET. A quiet news week would support such a zig-zag bottom before a trigger 'news event' can drive the market higher.

Bullish Percents

Image
The indices were thrown back into the quagmire of the past 2-month consolidations as the Bullish Percents flipped negative once more. It was interesting to see the DOW hold 12,200 as support: With a comparable support level (1,324) visible for the S&P: But resistance, rather than support, was clearer for the Nasdaq: Given the position of the bullish percents, should one view them as bullish or bearish? Bears will look to the lack of oversold conditions in the bullish percents as an opportunity to push stocks trying to lead a rally out lower. Bulls will see increasing strength from stocks posting new breakouts on point-n-figure charts as diverging from the weakness in the indices. As fewer and fewer stocks drag on the indices, the quicker - and sharper - the resulting rally will be. I hold to my opinion that January lows mark a significant bottom, but these may be violated for a brief period. Long positions look more favorable than short plays, but cash is not a bad place to be as

Bullish Percents mixed once more

Image
The Nasdaq Bullish Percent turned bearish with a drop below its 5-day EMA. If this weakness was to represent itself in the index I would look for a new closing low for February (but not necessarily a break of the month's intraday lows). However, the index does sit close to a break of declining resistance connecting January, and both February reaction highs - a big day this week would break through this resistance and likely negate the 'sell' trigger in the Nasdaq Bullish Percent: Better was the leading action in the Dow Bullish Percent. It finished Monday at 33% having managed a new reaction high for the month. This strength filtered through to the index Monday when it made its first break of the two reaction highs for February. Look for this strength to continue with a further push above 12,750 (but 12,200 can't be violated on a closing basis): The S&P Bullish Percents has yet to push above its February reaction high. The action in the index is a little better in t

Stagflation?

Image
I am no economist, but if you look at the relationship between Crude Oil Prices and the 10-Year Treasury Note there was a fundamental shift over the course of 2007. The market shrugged this off until peaking in October 2007, but there has been no indication from this relationship that things will be changing any time soon. Will this mean more bad news for the markets? Hopeful bulls looking for rally targets may find indices 200-day MAs, rather than new highs, best bets forward.

Early signs of revival?

After a good day on Wednesday, what can the bulls pull out of the bag next? On a closing basis there was a modest resistance breakout in the S&P, helped by the earlier February 12th 'Buy' signal in the Bullish Percents. Having said that, the S&P Bullish Percents need to break 35% soon if the momentum of the signal is not to be lost. The Dow Bullish Percents do exhibit better health, only the index has to pick up the pace. Closing support at 12,200 remains strong. The Nasdaq Bullish Percents still ride the January 24th 'Buy' signal, but a breakout has yet to occur in the index.

Bullish Percents rise once more

Image
The Bullish Percents have turned bullish (again!); although the Nasdaq Bullish Percent have been bullish since January 24th. The Dow is interesting as 12,200 looks to be support based on closing price . The S&P struggles a little and this could reverse as a whipsaw signal - but for now it is bullish. McClellan Oscillator holds on to bullish signal But indices remain vulnerable as recent gains fall well short of the prior week's selling. Double bottom confirmations will need 5%+ gains in the indices, which given the gains we have seen over the last few days could take a while.

Bullish divergences at play as Tuesday's gap breakdowns tempt....

Image
There is one stock for today, Contango Oil and Gas ( MCF ) available in the free section of my main website and made available to readers of my newsletter. As for the markets it is still a waiting game to close last Tuesday's gap breakdowns, although the 20-day MAs are likely to get in the way first. As a sidenote, there is an interesting divergence at play in the Percentage of Stocks above the 50-day MAs. When the market bottomed in January only 15% of Nasdaq stocks were above their 50-day MA. This rose to 26% as the market made a new closing low for February. This divergence is further supported by the bullish divergences in the Ultimate Oscillator and MACD trigger line. Also look at how a negative divergence played out during the October top. Trade my Stock Picks at

Bulls step in....

Image
The McClellan Oscillators held their bullish form as bulls stepped in, with volume, to stall 3-days of declines. At least on a closing basis (ignoring the intraday range) both the Nasdaq and NYSE are on course for a double bottom; confirmation will come on a closing break of 2,400 for the Nasdaq and 9,250 for the NYSE. Dow Theorists will take comfort in the strength of the Dow Transports. Note how bulls maintained control as other markets reversed from their late January bounce [+DI > -DI; ADX > 20]. Stochastics are overbought which suggests a pullback to test the 50-day MA is needed to shake out the last of the weak hands. Volume in this index has certainly sided with the bulls. Volatility watchers are unlikely to see another spike into the high 30's on this decline, and those waiting for a second spike before buying are likely to be disappointed. A push back to the 200-day MA would look to be the most likely scenario. Nasdaq theorists will look for the semiconductors to

Bullish Percents wavering

Image
Wednesday's selling - the third day of selling in a row - has started to pressurize the Bullish Percents and the validity of the January bottom. The Nasdaq bottom remains healthy and looks to be part of a bullish retest of prior lows. The Dow Bullish Percents have breached their 5-day EMA (bearish), but remain in deep oversold territory. More worrying is a similar breach of the 5-day EMA for the S&P Bullish Percents, but unlike the Dow, the crossover occurred away from oversold levels. Watch for the S&P to lead a break to the downside and through January lows. Both Nasdaq and NYSE McClellan Oscillators finished in positive territory which is bullish (just!).

McClellan Oscillator

Image
I was trying to remember which blogger had talked about the McClellan Oscillator but couldn't find the reference post (Sorry!). This is an indicator which I had overlooked in the past, but is another useful tool (if a little whipsawy). The crossover in the zero line gives an indication of bullish/bearish strength in the market - although given the whipsaw one should perhaps wait for confirmation on a move past +/-10. After Tuesday's selling both the Nasdaq and NYSE Oscillators are (holding) bullish - but another day of selling might change that. Of the market internals I do follow, the Percentage of Stocks Above the 50-day MA started to crack (it is usually the first to do so). However, the bullish divergence in its MACD holds with an overall technical picture which is net bullish. The other market internals; Bullish Percents and McClellan Summation indices, still support the January bottom. The S&P is doing its best to map out what I thought would happen over the coming w

Archive

Show more