If one was to only look at Daily Charts, all looks well: new highs, technicals net bullish, decent volumes. Looking at the Weekly Charts offers similar optimism: well maintained trends dating back to 2011, sustainable (i.e. non parabolic) ascents, firm technicals. The only thing indicating a wobble are breadth metrics.
The change in breadth metrics isn't outright bearish, and in itself may offer indices the basis for another big leg up, but the divergence to price is unusual. It has expressed itself more in supporting technicals of breadth metrics, rather than the breadth metrics themselves.
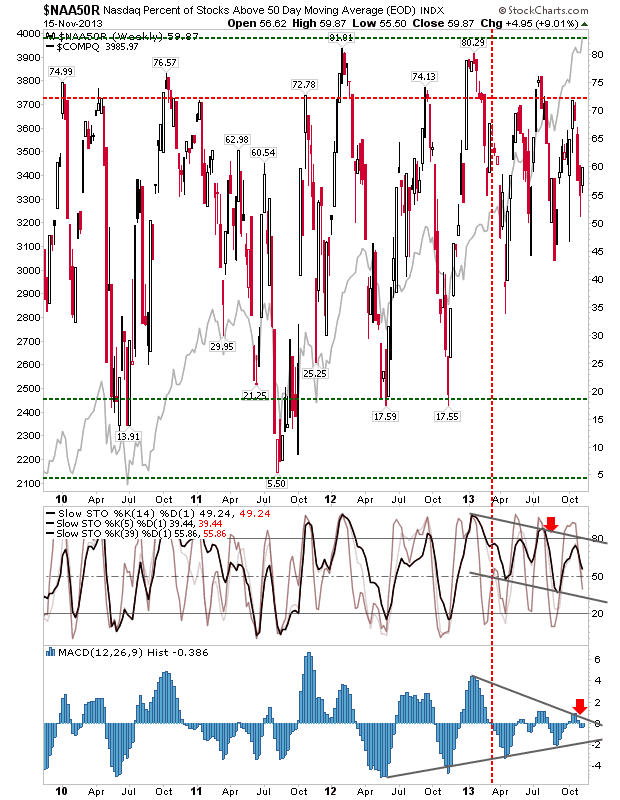
For example, the Percentage of Nasdaq Stocks above the 50-day MA peaked in late 2012 at 80%, but has struggled through 2013 to make a sustained move above 70%. It currently lies at 60%, which for a market pushing new all-time highs, is not particularly healthy. In addition, the MACD histogram is narrowing into a coil and the trend for intermediate stochastics [39,1] points to a downward trend. It suggests more Nasdaq stocks will fall below their 50-day MA, leaving fewer stocks to push the highs. This house of cards will tumble. Profit taking is the order of the day, but it's not a shorting opportunity - near term momentum is firmly in the bulls camp.
Technicals for the Nasdaq Bullish Percents have moved more firmly to the bear side. MACD histogram and intermediate stochastics are on 'sell' triggers, despite the resistance break for the breadth metric last year: 68% of stocks are on Point-n-Figure 'Buy' signals, which is still relatively healthy, but it's off the last swing high peak of 73%.
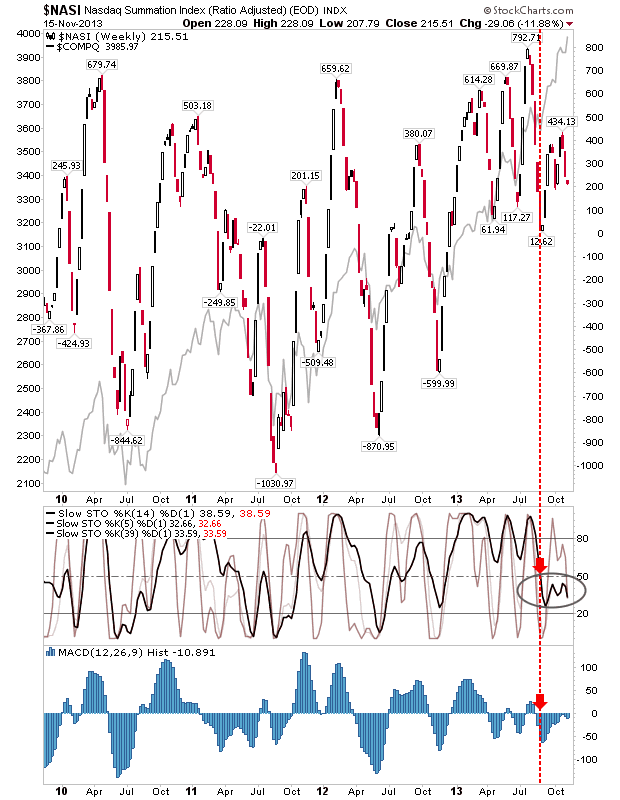
The Nasdaq Summation Index is usually a reliable min/max swing metric, but it has had a scrappy 2013. However, supporting technicals are firmly in the bearish camp. A break of zero support in the Nasdaq Summation Index would set it on course for a typical swing low below -500.
The last major support area for the Nasdaq was down around 3,200. I suspect the next down leg will offer a new major support level, with 3,500 perhaps the most likely area to see this (whole number psychological support, a peak swing high from earlier in the year, a 12.5% discount from current prices which would be a decent move down).
The S&P is not as bearish as the Nasdaq, so it should outperform the Nasdaq indices with money flowing from Tech to Large Caps. Technicals for its breadth metrics have already reached levels typical of a bottom and have bounced from them. However, the breadth metrics themselves are closer to resistance, and may struggle to get much further.
Now is the opportunity to take profits and build up cash reserves for the next major swing low. There is a level of greed in the market which will come back and bite victims in the ass who don't take advantage. However, market conditions do not call for short positions, nor do they call for a blanket sell of everything. The short term trend is up and we are entering a seasonally bullish period.
Sideline wanna-buyers have a harder decision to make. Momentum stocks will grab the headlines and offer 20-30% quick gains, but these stocks are becoming fewer and fewer in number (which just amplifies the gains when they are found). Many of the breakout stocks I'm now seeing fall into this category; i.e. they become repeat entries to my list with little time for consolidation between the jumps. If looking to trade momentum, keep opening risk low.
---
All Contributions Welcome - Thank You!
Follow Me on Twitter
Dr. Declan Fallon is the Senior Market Technician and Community Director for
Zignals.com.
You can read what others are saying about Zignals on
Investimonials.com.
JOIN ZIGNALS TODAY - IT'S FREE!