Posts

Daily Market Commentary: Tight Trading

Image
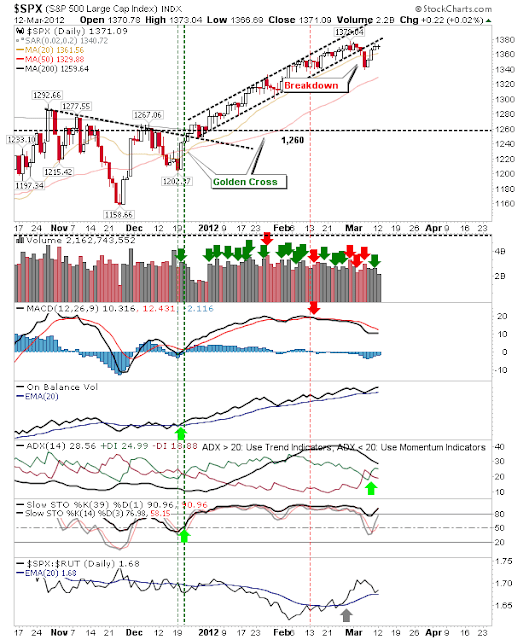
Monday traded like a holiday with low volume and a narrow intraday range.  It was no coincidence this action occurred near resistance, with bulls doing little to challenge it. The S&P posted a small doji just below the February high.  Technicals hed firm with the MACD on course to trigger a 'buy' and reverse its one bearish indicator. Swing traders can use a break of Monday's doji high/lows as the basis for a trade. The Nasdaq experienced a similar day, closing slightly down.  The index is sitting on the cusp of a challenge on 3,000. But semiconductors suggest the Nasdaq might have to wait a little longer before it breaks 3,000. Today's semiconductor action was a clear reversal of Friday's gain, below February's congestion and away from its 20-day MA. Small Caps are attempting a move inside the February congestion zone but it's encountering supply at its 20-day MA; a moving average both Nasdaq and S&P have cleared. On Tuesday, l

Weekly Market Commentary: Finishes Week Near Highs

Image
It was a good week for indices as market breadth offered a swing low while parent indices closed near their highs.  The Nasdaq was the best case in point. The Nasdaq dug its heels at 2,900 on lower volume helped by decent technical strength. Lending weight for a continuation of the Tech rally is the swing low in the Percentage of Nasdaq Stocks above the 50-day MA.  A similar pattern emerged in 2010 which was the basis for a new reaction high in the Nasdaq. The Russell 2000 was able to find support at the former neckline head-and-shoulder pattern, turned support. While the S&P positioned itself for a challenge on 2008 highs. Although the concern is a swing high in the Bullish Percents, which suggests lower prices ahead for the S&P. There is a bit of a divergence in market breadth; S&P breadth is pointing towards a top, while the Nasdaq is favoring a trade-able bottom.  Despite this, further gains would appear to be favoured given the strong positio

Daily Market Commentary: Decent Recovery But Volume Lacking

Image
Whatever attacks Shorts may have planned failed to materialize as markets closed near their highs. Volume was below yesterdays and below the heavier selling volume of Tuesday. Markets which traded just below 20-day MAs before today's open managed to finish the day above them.  At least for now, buyers are prepared to step in and bid markets up while sellers have remained largely absent. The S&P recovery will soon have to contend with former channel support - turned resistance. Techncials are holding on the bull side, although ADX has become prone to whipsaw; recovering to the bull side after a recent 'sell'. The Nasdaq gapped above its 20-day MA and managed to spend the whole day above this moving average. Volume climbed to register a mild accumulation day as on-balance-volume reversed yesterday's sell trigger. The index is well position to challenge the 3,000 high. The Percentage of Nasdaq Stocks above the 50-day MA managed to find support at the rising

Daily Market Commentary: Partial Recovery

Image
Buyers stepped in to eat some of yesterday's losses but it wasn't enough to reverse the course of the selling.  None of the indices 20-day MAs were breached to the upside, meaning shorts will still have their opportunity to attack tomorrow. The Nasdaq is best primed for a short attack.  Today finished just below the 20-day MA as the breakdown gap was closed. Today's modest buying did enough to reverse yesterday's 'sell' trigger for on-balance-volume. The semiconductor index enjoyed the best of the buying as bulls stepped in at the 50-day MA. But the buying wasn't enough to stop a net bearish turn in technicals for the index.  However, there should be significant support around 400 if the 50-day MA fails.   The S&P didn't quite make it to its 20-day MA. Technicals are relatively unchanged from yesterday: The earlier 'bear' triggers for the MACD and +DI/-DI intensified their decline, but there were no new technical 'sell' t

Daily Market Commentary: Sellers Press Advantage

Image
Market losses fell into the 1-2% range; Small Caps suffering more than Large Caps or Tech Indices. On charts, todays' losses looked worse than might have otherwise been considered given the 'baby-step' rallies. Volume climbed to register a distribution day, but overall volume was relatively light - so Tuesday's selling was not a rush to the exits. However, concerns remain. Hardest hit was the Russell 2000. Selling took the index below its 50-day MA, leaving 764 then the 200-day MA as the next targets for support. Technicals are set to turn net bearish over the next few days which may dissuade traders from buying. The Nasdaq gapped below its 20-day MA, leaving the index in a void between 20-day and 50-day MAs. Wednesday morning trading may see this gap close, but look for shorts to get aggressive at the 20-day MA. The S&P suffered a clear channel break, following the lead of Small Caps and recently Tech in losing such support.  Tuesday's selling took

Daily Market Commentary: Nasdaq Breakdown

Image
A mixed bag of action.  Large Caps were able to recover intraday losses and hold channel support, but Tech indices suffered gap breakdowns with channel breaks,  Leading the push down was the semiconductor index. The index lost rising support in February and is only a few points shy of a test of the 50-day MA. The hit in the semiconductor index contributed to the channel break in the Nasdaq. Although the Nasdaq was able to defend its 20-day MA. The Nasdaq 100 similarly dropped out of its rising channel and is on course to test its 20-day MA. Small Caps recovered the intraday loss as it approaches its 50-day MA.  But this followed from a loss of its rising channel as relative strength continued to deteriorate. Meanwhile, the S&P was on course to also break from its channel, but by the close of business it had recovered its intraday loss. For Tuesday, look for tests of 50-day MAs for the Russell 2000 and semiconductor index. The latter will coincide with tes

Weekly Market Commentary: Breadth Weakness Increases

Image
Indices were little changed, but supporting breadth metrics continued their decline. Of the indices, only the Russell 2000 took a hit. The Russell 2000 was rebuffed from a break of 830, giving up almost 3% on the week.  It's on course to test former resistance - turned support - of the former head-and-shoulder neckline. If this fails, next support lies at channel support (initiated in 2011). But Nasdaq Breadth offered the real divergence to the parent index.  The Nasdaq was able to close the week up just under a 0.5% on higher volume accumulation. But supporting breadth indices, like the Percentage of Nasdaq stocks above the 50-day MA, fell sharply. Along with the Nasdaq Summation Index. While the Nasdaq Bullish Percents continued its peaking process, closing down slightly. While this process continues the prudent course is to move to the sidelines or at least be more wary on buying.  However, this is the first decline from a very strong advance in breadt

Archive

Show more