(Running late; did half of this before Monday's open so some of the comments are already dated) Bulls are trying, but the November lows appear to be sucking the life out of them. What had the Stockcharters to say about it.
Yong Pang lists a neutral to nascent bull environment in the short term, within the context of a bearish intermediate time frame.
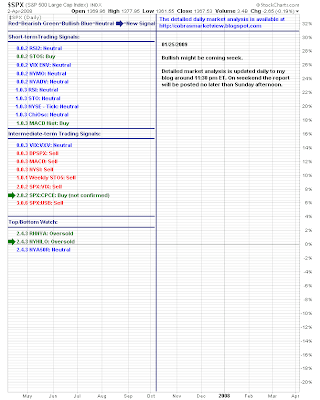 Looking at this chart I would think things would get worse over the next couple of days before rallying back to January highs...

But I see on the SPY chart how a short term bullish scenario could play out:

Although breadth indicators remain bearish

30-min chart SPY also looking weak:

Maurice Walker is on the soap box this week. I agree with some of what he says in principal, but in practice what he states can never happen thanks to greed and corruption. Unfortunately it's a case of damned if you do and damned if you don't; greed and corruption exists on both sides of the fence and given recent events I'd take government pork barrel over banking meltdown. As far as I am concerned Execs responsible for this mess need to go to jail for their failings, and not some white collar holiday camp either. They certainly shouldn't be keeping their jobs (and salaries). Better again, bring back the pillory; stick the CEO's of the banks in Time Square where the general public can throw rotten tomatoes at them - public humilation would probably work as well as any jail term. Grrrr.......
Anyway, back to the market. Maurice has a pennant on the S&P daily chart much like Pan's:

Interesting bearish head-and-shoulder pattern to watch for:

and his version of the bullish head-and-shoulder pattern has a few bearish overtones to consider - notably the TRIX:

Joe Reed has his summary:

Weekly support is where the action is at:

US Dollar Index fast approaching resistance; will it ease back to the 82s?

I'll close with the comments of Richard Lehman:
1/24 -- The trouble with bottom retests is that once they become universally anticipated, they tend not to occur -- at least not precisely. The obvious thing on every market watcher's mind is a retest of the November lows on the DJIA and the SPX. Therefore, don't count on it. We will either stop short of it or go through it to a new low. I can't guarantee which yet, but I see signs on several charts of upside in the short run, so I'll go with the 'stop short' scenario for now.
This week had a succession of new lows and failed rally attempts that whipsawed just about all of us. The lows, however, all touched the lower purple channel lines with precision and then came up to the red minichannel lines and hit those, squeezing between these lines into Friday. Both have held several times and neither has broken, though one will have to soon. Meanwhile, though, Friday was a turning point on several charts worth noting. The low on the QQQQ, SPX, XLE, XLF, and XLK on Friday was a HIGHER LOW than the prior one. This leaves the possibility that a mini upchannel has finally begun off the purple line. I've drawn that mini on the QQQQ and SPX charts. Bear in mind that its not very steep on the upside, but given everyone's hesitation to be long here, I'll take even a modest bounce and see where it goes. If people fear they've missed the retest (or that it won't happen) they will climb on board later.
From the long term perspective, we MAY have an upchannel now off the November low using this week's lows and I've drawn that possibility on a few 3-year charts as well. We'll keep that possibility in mind, though not get too married to it just yet.
Good start for the bulls Monday...
Dr. Declan Fallon, Senior Market Technician, Zignals.com the free stock alerts, market alerts and stock charts website


