Weekly trend break for S&P
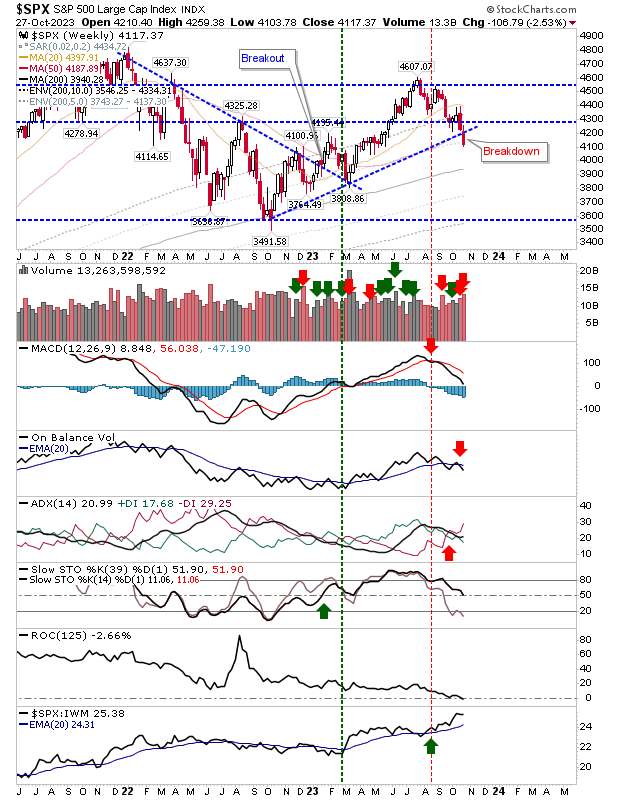
Daily charts show indices in a bit of a freefall, so focus shifts to weekly timeframes. The S&P was the last of the lead indices to break weekly-trend support, lining up the 200-day MA for the next support test. Volume climbed to register as distribution, rubbing salt into the wound of bulls. The only positive for bulls is that intermediate stochasics [39,1] are above the bullish mid-line, but with other technicals turning negative it's unlikely to stop the rot.