Posts

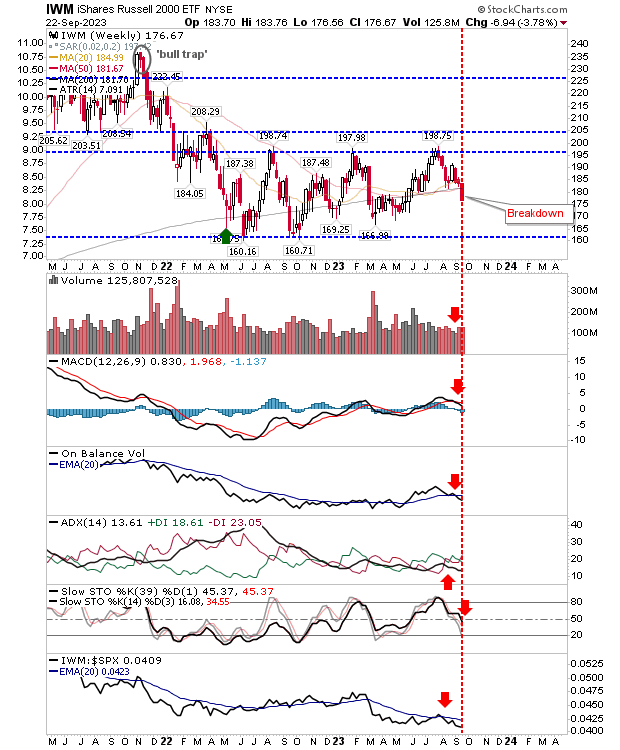
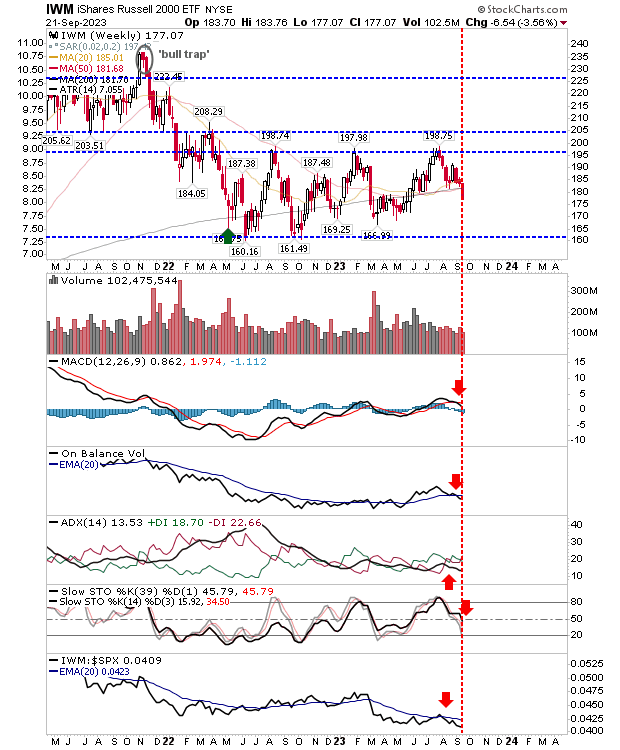
The Russell 2000 sells off hard on volume distribution

Image
The Russell 2000 ($IWM) is the canary in the coal mine for markets and today's action is not great news for the S&P and Nasdaq, despite the latter indices doing 'okay' today. Selling volume rose to rank as distribution with a 'sell' trigger for On-Balance-Volume. Relative performance accelerated in its decline against the S&P (and Nasdaq), but this has been the case since August. The only positive is the residual MACD 'buy', but this signal occurred well below the MACD zero line, not a good trade signal and one liable to fake out.

Swing lows taking shape across indices

Image
It's early days, but indices are working towards swing lows to help start rallies off last week's lows. The Nasdaq took out the swing high from last week and its 20-day MA, but was repelled from its 50-day MA with today's spike high. The buying came with MACD trigger, ADX and On-Balance-Volume 'buy' triggers. If the buying continues, then a stochastic 'buy' will complete the net bullish technical picture over the coming days.

Nasdaq and S&P hold weekly support

Image
Friday's surge on daily time frames set up solid finishes on weekly time frames for the Nasdaq and S&P, although the Russell 2000 ($IWM) remains in trouble. The S&P has posted a 'bullish' hammer on 4,275 support, although the reversal potential of this candlestick is reduced by intermediate-term momentum caught in a bit of a no-mans land, but short term momentum is oversold and volume registered as accumulation. What the strong finish has also done is set up a new relative performance high against Small Caps via the Russell 2000 ETF ($IWM).

Russell 2000 ($IWM) experiences two heavy days of selling

Image
It has been a tough start to the week for the Russell 2000 ($IWM). A bearish end to the week last has been followed by a disappointing Monday. The measured move target marked on my chart offered a launch point for a rally, but this rally quickly got overwhelmed by a former support level, turned resistance, around $178. To add to the misery, volume climbed in confirmed distribution for both Friday and Monday, and relative performance against peer indices (Nasdaq and S&P) took a sharp turn lower. There is no love for market leading Small Caps, and now have to look at 2022 lows around $160 as a possible support test.

Yesterday's buying quickly undone by today's selling distribution

Image
It was a slam dunk day for bears as whatever support, such as the retention of 4,325 in the S&P, was sliced apart. We are now looking at measured move targets for the Russell 2000 ($IWM), S&P, and Nasdaq, and tests of their respective 200-day MAs. The S&P is on course to reach its measured move target, with a good chance for a follow through to its 200-day MA. Technicals are net negative, but the index is still outperforming peer indices.

Russell 2000 ($IWM) sees break of 200-week MA for a fourth time in 2 years

Image
While the index has recovered from breaks of its 200-week MA before, every such test (and break) of the moving average increases the chance of a flip from a level of support to resistance. Supporting technicals for the index are next bearish, but more importantly, since the sharp shift in relative performance against the S&P in March, the index has struggled to regain the initiative. More importantly, the summer rally barely registered in terms of relative performance. This means the likelihood for a move to an oversold state is high, and therefore further losses can be expected here.

Two days of selling has us looking at market breadth metrics

Image
Friday's action will determine how we finish on weekly time frames, but the likelihood for an ugly close to the end of the week is high. If things stay as they are we will see a breach of the 200-week MA (along with 20-week and 50-week MAs) in the Russell 2000 ($IWM) and the likelihood this most recent breakdown will lead to a larget sell off, something the index managed to avoid on earlier such breaches in 2022 and early 2023.

Archive

Show more