Posts

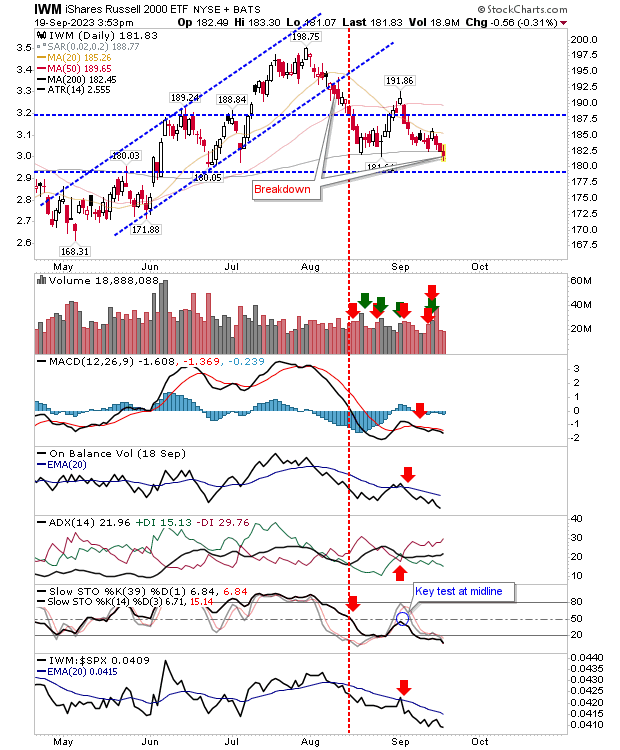
Yesterday's buying quickly undone by today's selling distribution

Image
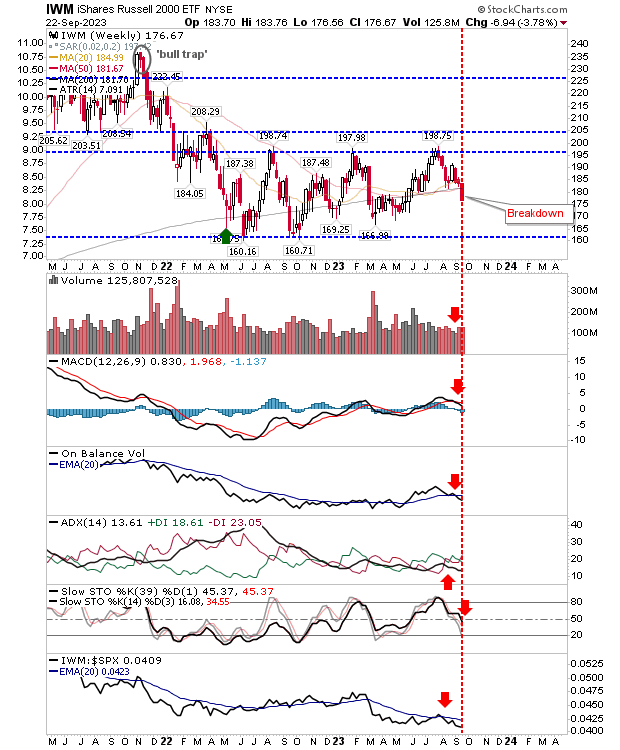
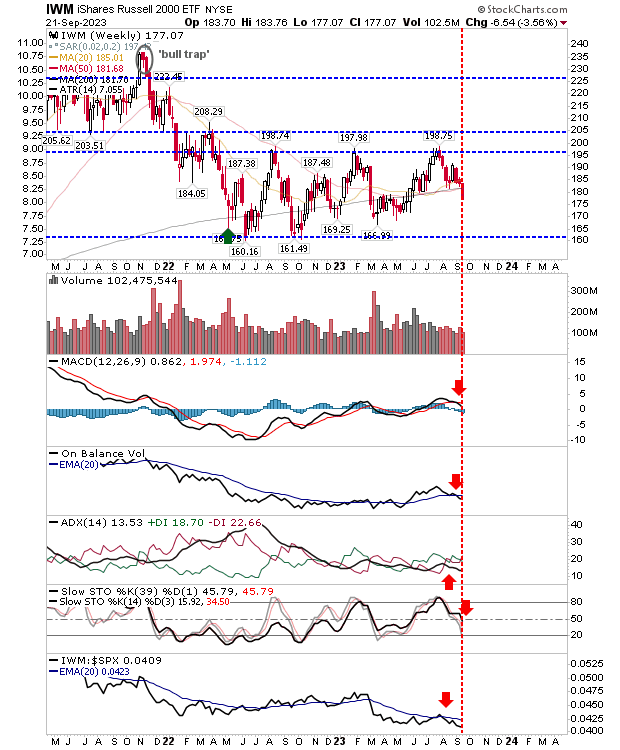
It was a slam dunk day for bears as whatever support, such as the retention of 4,325 in the S&P, was sliced apart. We are now looking at measured move targets for the Russell 2000 ($IWM), S&P, and Nasdaq, and tests of their respective 200-day MAs. The S&P is on course to reach its measured move target, with a good chance for a follow through to its 200-day MA. Technicals are net negative, but the index is still outperforming peer indices.

Russell 2000 ($IWM) sees break of 200-week MA for a fourth time in 2 years

Image
While the index has recovered from breaks of its 200-week MA before, every such test (and break) of the moving average increases the chance of a flip from a level of support to resistance. Supporting technicals for the index are next bearish, but more importantly, since the sharp shift in relative performance against the S&P in March, the index has struggled to regain the initiative. More importantly, the summer rally barely registered in terms of relative performance. This means the likelihood for a move to an oversold state is high, and therefore further losses can be expected here.

Two days of selling has us looking at market breadth metrics

Image
Friday's action will determine how we finish on weekly time frames, but the likelihood for an ugly close to the end of the week is high. If things stay as they are we will see a breach of the 200-week MA (along with 20-week and 50-week MAs) in the Russell 2000 ($IWM) and the likelihood this most recent breakdown will lead to a larget sell off, something the index managed to avoid on earlier such breaches in 2022 and early 2023.

Russell 2000 ($IWM) undercuts 200-day MA as indices struggle

Image
It has been a rough summer for investors with markets pushing losses for the last few months. It's not all doom and gloom, with markets more range bound than permanently damaged. The Russell 2000 ($IWM) got the pillorying today as it undercut its 200-day MA on distribution volume. Technicals are net bearish with momentum oversold, but there is another nearby price support level around $178 to lean on. While today's action sits firmly in the bearish camp, it will take a lot more selling to reverse the June 'Golden Cross' between the 50-day and 200-day MAs, and in its current oversold state there is a good chance for a bounce of merit.

S&P and Nasdaq flag distribution heading into next week's Fed decision

Image
The headlines will focus on next weeks Fed decision, but markets had their own big end-of-week finish with triple witching options expiration combining with a sell off to leave the S&P and Nasdaq in a little trouble. The S&P, having managed to edge past the 50-day MA on Thursday, quickly found itself on the wrong side of the line by Friday's close. While triple witch volume clouded the volume, Friday's selling still likely counts as distribution.

Successful test of 200-day MA in Russell 2000 ($IWM)

Image
After yesterday's push down to the 200-day MA in its third test of the moving average since early August, there was a accumulation worthy counter move higher that returned the index back to its 20-day MA. The problem is repeated tests of support (or resistance) eventually lead to breaks. Today's gain looks good, but I would like to see a rally from here up, and through, the 50-day MA. Otherwise, I suspect a fourth test of its 200-day MA will see a breakdown.

Russell 2000 ($IWM) lingers at 200-day MA

Image
There wasn't a whole lot of change from my last post. The Russell 2000 ($IWM) is holding just above its 200-day MA, but has been curtailed by its 20-day MA; this squeeze will have to resolve eventually, but the likelihood for a breakdown is higher because of the weak technical picture.

Archive

Show more