Posts

The S&P and Nasdaq are rebuffed at 50-day MAs, but Russell ($IWM) has potential

Image
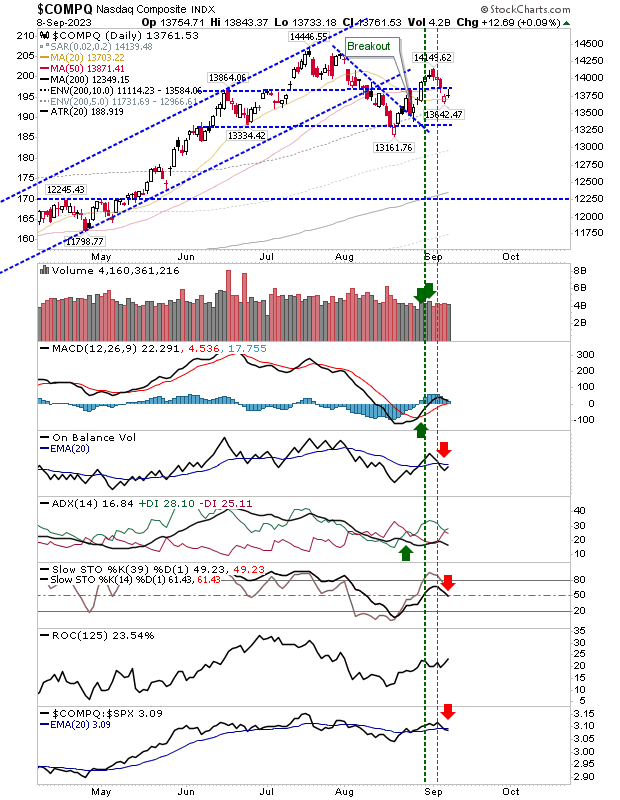
Friday's brief recovery for the S&P and Nasdaq quickly found itself running into trouble at their respective 50-day MAs. It was a little different for the Nasdaq in that it started the day at its 50-day MA, but the early rally stalled out after it closed the Thursday gap down. The Nasdaq experienced a new 'sell' trigger in slow stochastics and an underperformance relative to the S&P, joining the earlier 'sell' trigger in On-Balance-Volume. Given that, I would be looking for some weakness early next week, but a close above Friday's doji high would negate the weakness of that candlestick.

Russell 2000 ($IWM) coming up to test of 200-day MA

Image
The selling of the last few days hasn't abated and we have a situation where the Russell 2000 ($IWM) is now looking at a test of its 200-day MA. There is a mix of technical strength, with On-Balance-Volume and ADX on bearish signals, keeping with the initial bearish signal in stochastics (a signal which, ultimately, didn't get to challenge the mid-line). The index is also underperforming relative to the S&P and could soon be making a new swing low in this regard.

Selling in Russell 2000 ($IWM) undercuts breakout support

Image
The warning signs were there for the Russell 2000 ($IWM), and today's action delivered on that foreshadowing. Sellers pushed the Small Caps index below 20-day and 50-day MAs along with the June swing high. Volume rose to register a distribution day, along with a bearish reversal in the ADX and a relative performance loss against S&P. The next target for support is the 200-day MA, but it's going to take a few days of selling before it gets there.

Import test for Russell 2000 ($IWM) as Nasdaq and S&P turn net bullish

Image
The Labor day weekend will keep things on hold for another day, but the coming week is an important one for lead indices. We have the Russell 2000 ($IWM) at the cusp of a return to a net bullish state in its technical picture, matching the state for the Nasdaq and S&P on the daily timeframe. The only hold out is the stochatic [39,1], that hasn't yet crossed the midline. Friday's closing candlestick for the Russell 2000 was a littly iffy and in combination with stochastic mid-line resistance could spell a period of weakness for the week. However, from a price perspective, it's trading above $189 breakout support and key moving averages, so there is reason to be optimistic here. Another tick in the bullish column is the net accumulation in volume.

Nasdaq moves past swing high on improving technicals

Image
Today was a good day for bulls, but there is still work to do before technicals turn net bullish. For the Nasdaq, what was particularly gratifying was the close above the high of the bearish engulfing pattern from last week, along with key moving averages. This came on the back of new 'buy' signals for the MACD, On-Balance-Volume and ADX - along with net accumulation for volume. It was a solid day, with the sort of candlestick that often represents the anchor for a swing low, but let's not get ahead of ourselves. The S&P had a similiar kind of day as the Nasdaq, packing gains on higher volume accumulation from a start at converged 20-day and 50-day MAs. ADX, On-Balance-Volume and the MACD are all on 'buy' signals with only stochastics left to turn bullish. The S&P is outperforming the Russell 2000, but not the Nasdaq. One thing to watch for tomorrow is if today's buying will act on resistance derived from the former rising channel. The

Bulls take the market for a spin, but lack revs

Image
In principle, Friday's action was relatively bullish with some decent bullish candlesticks at support. Volume was a little mixed, in that there wasn't across the board accumulation, but we will take what we can. The Russell 2000 ($IWM) closed with a 'dragonfly' doji at its 200-day MA on higher volume accumulation. It was the second such test in a couple of weeks, which increases the probability of an undercut of the moving average. There is still good support at $179 should this happen, but I wouldn't be counting on this should the break happen.  Technicals are net bearish and Friday's action did little to improve that. 

Weak rallies carry a bearish overtone

Image
Buyers make a reapparance after an extended period of selling. However, where in late spring and early summer any gain helped fuel a rally, this time, sellers have control of the market so that any buying will raise doubts as to its capability to dig the market out of its slump. In the case of the Russell 2000 ($IWM), we had a continuation of the bounce off the 200-day MA, although today's gain came off lower volume. The real killer is the relative underpeformance of the index against the S&P; although, in a six-month timeframe is all a bit scrappy.  While bears have an advantage, I would see enough here for bulls to take the index into a test of (soon to be) converged 20-day and 50-day MAs. 

Archive

Show more