Posts

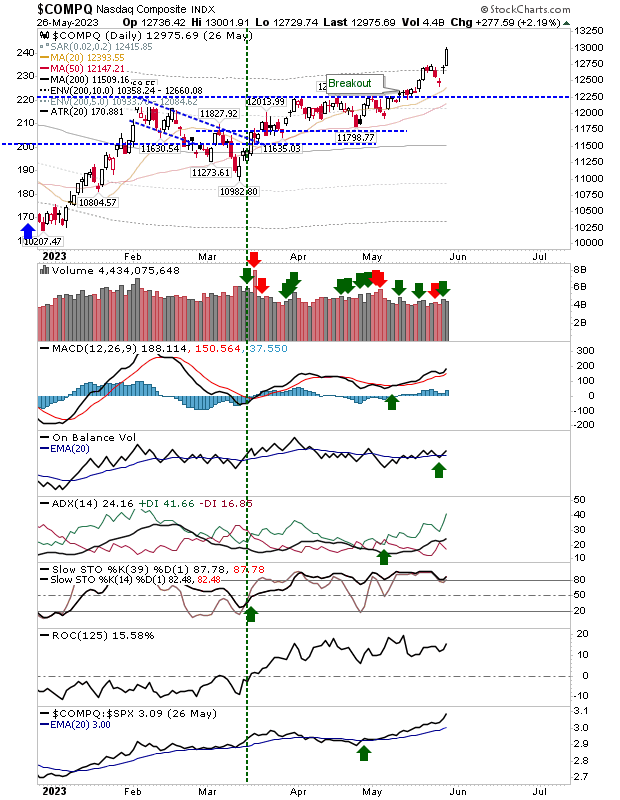
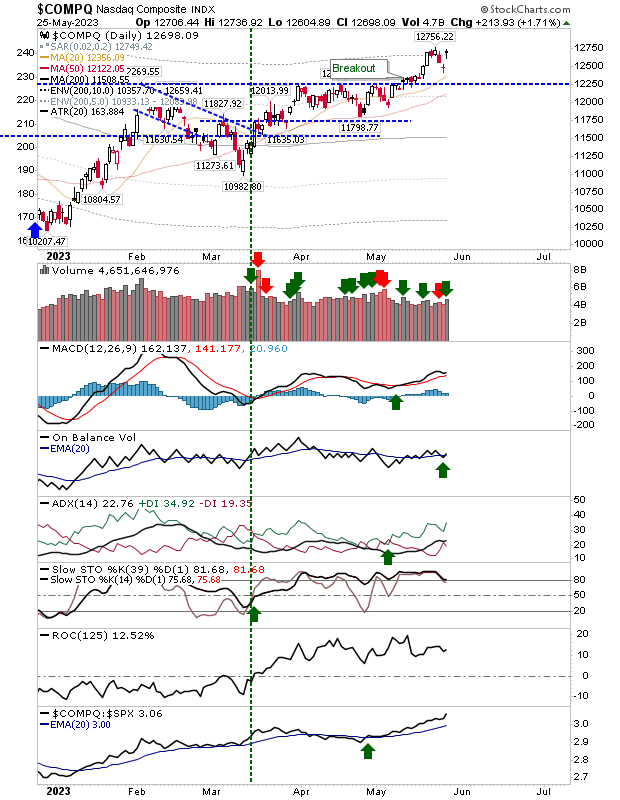
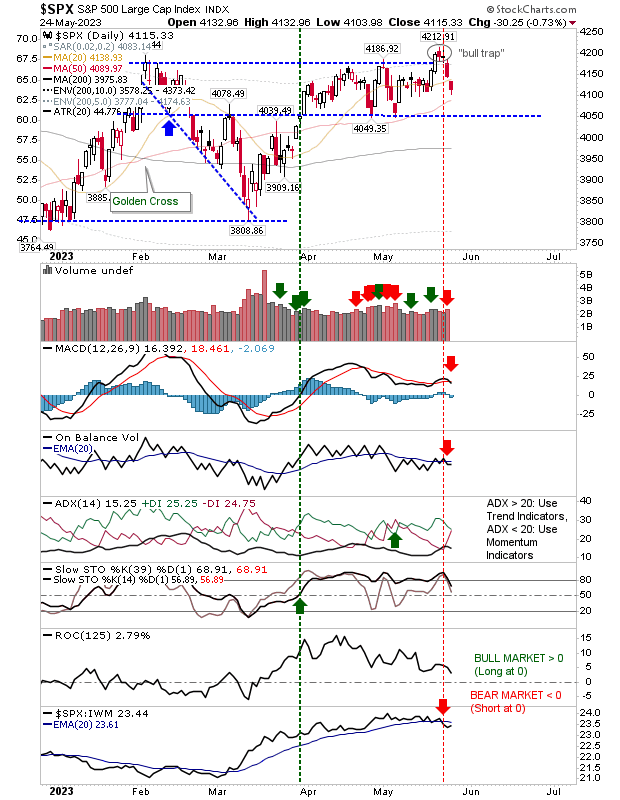
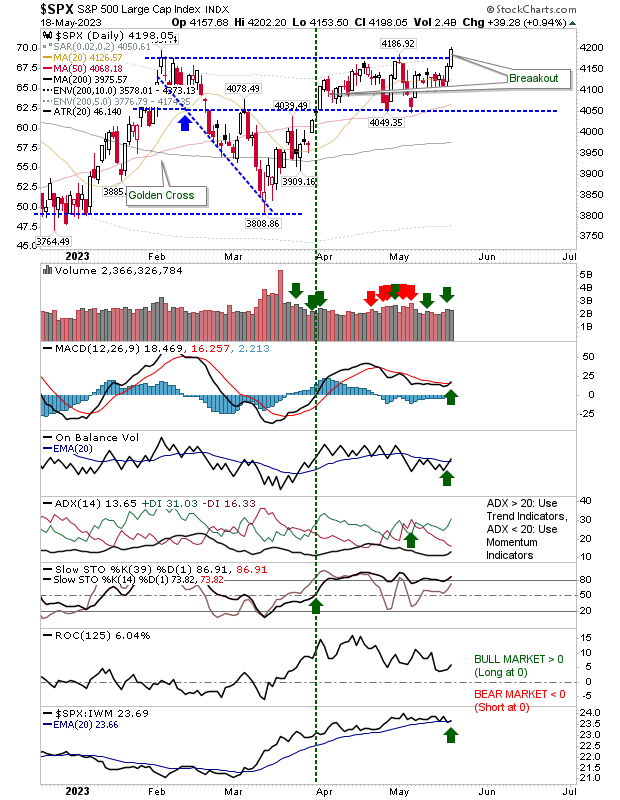
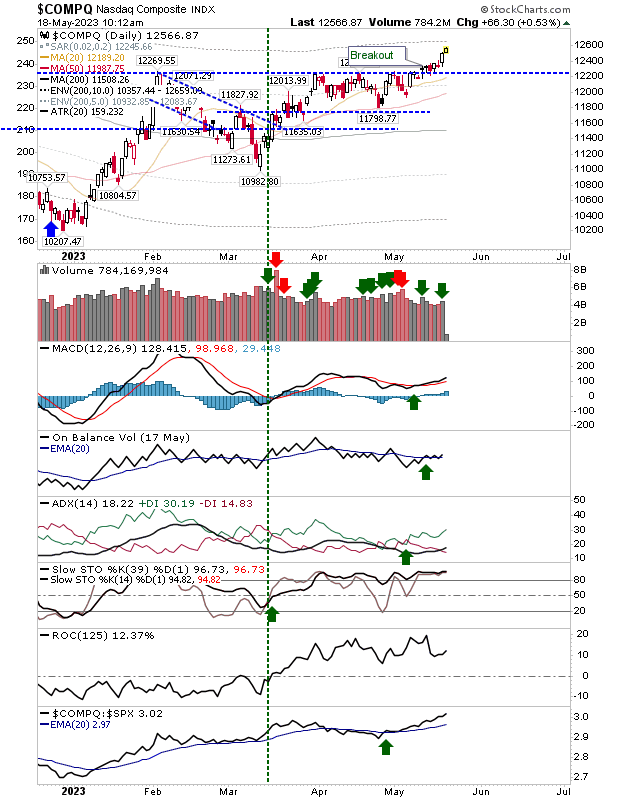
Peak "Black Candlesticks" again offer cause for concern

Image
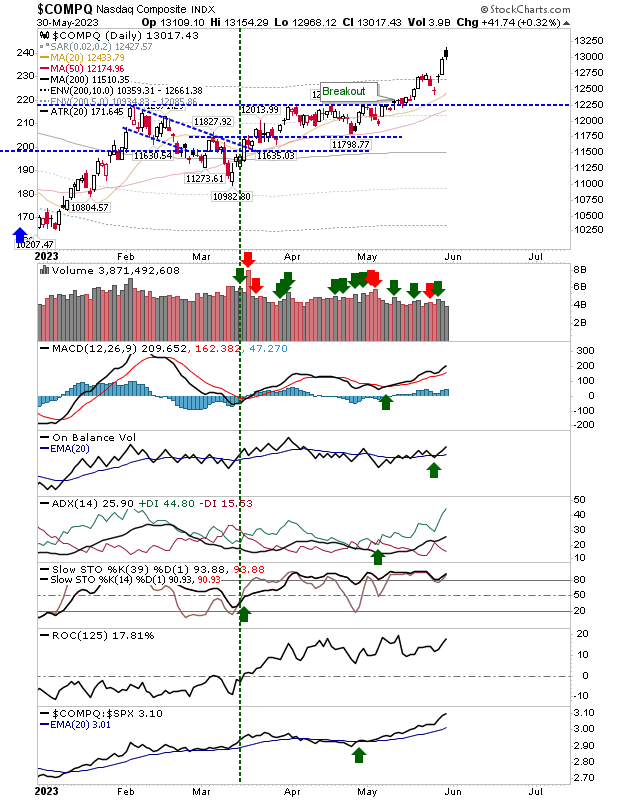
With junior traders likely to be still holding the reigns after the long weekend it was worrisome to see 'black' candlesticks pop into the charts of the Nasdaq and S&P.  If there is a bullish caveat, it's that the significance of these candlesticks is reduced in the absence of a prior rally.  The Nasdaq is perhaps the most vulnerable in this regard, but only because it has extended itself beyond its breakout point. However, I would expect this index to come back towards the 12,250 level over the coming days and weeks.

Solid gains into Memorial Weekend as Semiconductors surge

Image
Friday offered itself as a solid day for bulls, the only thing it lacked was volume. All indices gained, even the struggling Russell 2000 ($IWM), although some of my individual stock plays haven't enjoyed such gains.  The Nasdaq enjoyed the best of the action has it builds on its (now) well establish breakout.  It currently trades 12.7% above its 200-day MA, which by the table at the bottom of the post is just shy of 15% of historic price extremes (and a time to take profits or sell a 'covered call').  Technicals are net positive and the index is accelerating in relative performance against the S&P.

"Black Candlesticks" are a concern for the S&P and Nasdaq

Image
A bright start for bulls on the back of positive $NVDA earnings wasn't enough to generate a day of meaningful gains.  However, it did help stall the losses of the last couple of days. The Nasdaq was the biggest beneficiary of today's action, but not enough to see an end-of-day finish that cleared last week's swing high, nor delivery of a large white candlestick, despite the morning breakout gap.  Technicals are net bullish and relative performance against the S&P has become consistently stronger since the start of May.  While today's candlestick I would view as typically 'bearish', today's volume ranked as confirmed accumulation (bullish). Overall, I would be looking for higher prices from here. 

S&P "Bull Trap"?

Image
I thought there was sufficient evidence to argue against a "bull trap" in the S&P, but it would appear the market wasn't interested in such thoughts and sellers were quick to reverse the initial push above 4,200.  Adding to the pain were new 'sell' triggers in MACD and On-Balance-Volume, although the former occurred above the 'bullish' zero line, making it a weak signal. Selling volume ranked as distribution as selling momentum picked up speed.  The index is also underperforming relative to the Russell 2000. 

S&P Breakout

Image
If you missed the morning opportunity or were waiting for confirmation, well the S&P delivered with a solid breakout, albeit on modest volume.  Today's breakout came with a MACD trigger 'buy' and On-Balance-Volume 'buy' signal, leaving technicals net bullish.

Starting to see separation and some follow through for Nasdaq and Russell 2000

Image
Things are picking up for bulls.  The Nasdaq added a solid white candlestick to make the current move look more like the breakout that started (and stalled a little) last week.  Add to that, Wednesday's buying came with confirmed accumulation.  Technicals are net positive, so it's good news all around for the index. 

Another small step for man...

Image
No great change on the day.  Buyers maintained control of markets, banking small gains on low volume.  The longer this continues, the better the chances we will see an acceleration to the upside.  The Nasdaq has been slow and steady.  Technicals are net positive with a return to the 'buy' trigger in On-Balance-Volume.  The index is holding on to its outperformance against the S&P and closed at a new high - reversing all of Friday's losses.

Archive

Show more