Posts

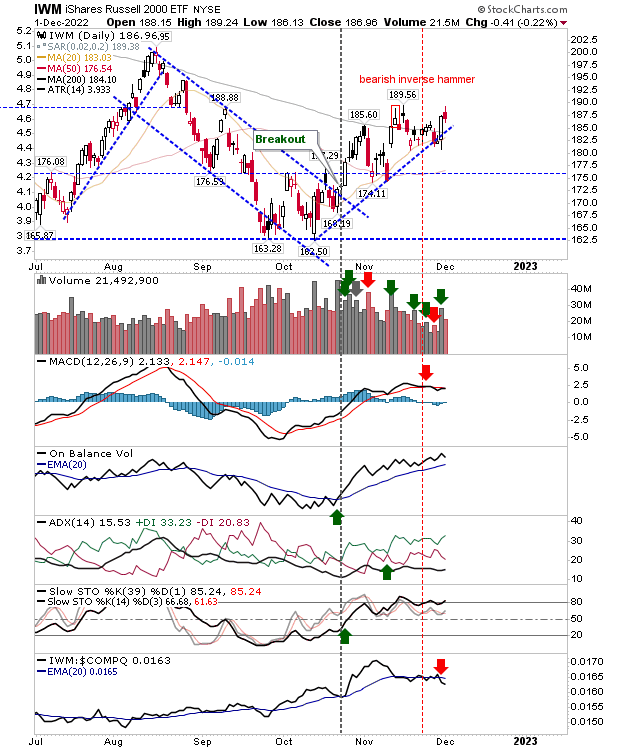
A weak start to the week, but this is not important

Image
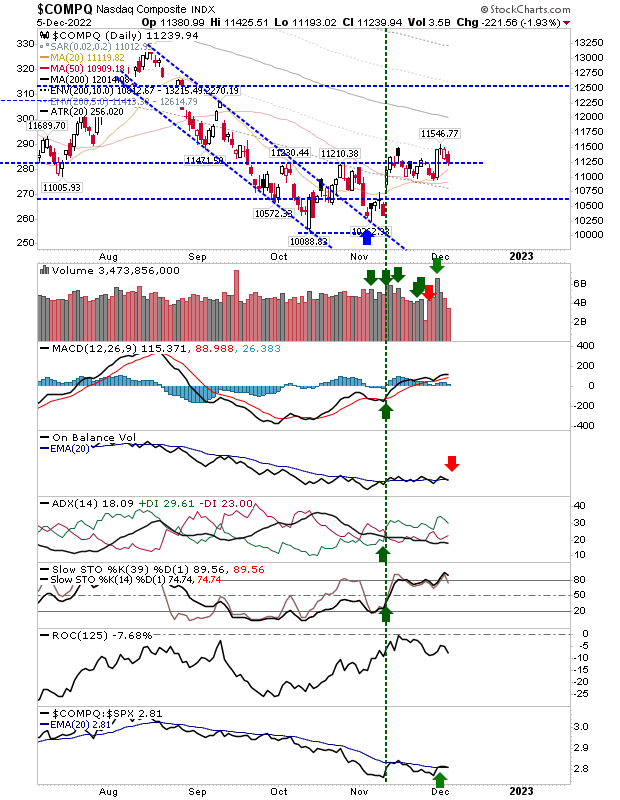
We don't want to dwell too much on today's action, although at the same time, we don't want the selling to get away from us. Sellers were able to push markets lower on light volume.  The Nasdaq drifted back to support, but was able to hold the prior support level (at least, support before the 'black' candlestick appeared).  There was a 'sell' trigger in On-Balance-Volume but there is a large degree of whipsaw in this indicator since the swing low in November.  There is a modest uptick in relative outperformance against the S&P which may help the index build out from its November bottom, but this nascent trend needs to continue.

Weekly S&P Chart At Resistance

Image
With the end-of-year fast approaching and Santa coming to town, all eyes will be on the S&P next week.  This index finished the week on resistance in a set-up which offers a good chance by the close of business on Friday there will be a breakout.  On the weekly chart, there was a MACD trigger 'buy' and On-Balance-Volume 'buy' to go with an upcoming out-performance against peer indices. Even if there is no price breakout this week, a close above the mid-line of Stochastics [39,1] would suggest a price breakout will be along soon enough.

#Sectorbreadth

Image
A regular feature of my Stocktwits and Twitter feed is my #sectorbreadth posts. Sectorbreadth is a measure of the technical strength of component stocks within each S&P SPDR ETF.  Technical strength is derived from the volume, trend, and momentum indicators for each stock.  The percentage score relates to the total of stocks within each ETF on a 'buy' signal.  When more than 90% of component ETF stocks are on a 'buy' signal I consider the sector overbought - and the ETF or component stocks worthy of some profit taking (or a covered call strategy). When fewer than 10% of component ETF stocks are on a 'buy' signal I consider the sector oversold - and the ETF or component stocks worthy of accumulation or a long trade.  I track these trades in my premium Stocktwits room ($149/month with the coupon code  fallondpicks ).  Below is a chart showing how this strategy plays out: The original post: Get a 50% discount on my Roth IRA with a 14-day free trial. Use cou

#Stockbreakouts

Image
On my Stocktwits and Twitter  feed, I post regular results from a breakout scan. This scan returns stocks that cleared significant resistance, but as of yet, have not made new 52-week highs.  I also include a count of any penny stocks which also were found in the scan; the more penny stocks relative to the total count, the more skeptical you should be of the featured stocks succeeding - when penny stocks are featured it's because of the greed of retail traders - and those aren't the traders you should be following.   How best to use this list? Look at the #stockbreakout list of 5-7 days ago; you want to find stocks that have held the breakout, but may be offering a better risk:reward than when first featured in my post.  What do these stocks look like in a chart? I don't post charts on these stocks, but I do compile the list by looking at their charts.  Here is an example: Get a 50% discount on my Roth IRA with a 14-day free trial. Use coupon code fallondpicks at G

Invest4Success

Image
If, like me, you are not flush with cash to trade, I keep a Roth IRA which I use to snail-trade to wealth.  This account uses a small amount of cash allocated monthly from salary - along with blog income from Google Adsense - to invest gradually in dividend income stocks.  The reality is most people I have met through the years don't have the level of capital to trade successfully and would be better off using tax-efficient accounts, such as a Roth IRA, to accumulate wealth.  Invest4Success is a Stocktwits Premium room that tracks the monthly investments I make into my Roth IRA. It's a back-to-basics approach that uses well-established names, a buy-and-hold strategy, and dividend re-investment to build value.  Eventually, I will use covered calls to generate additional income, but this is probably a year away.  If you are interested, it costs $249 a year, but you can get a 50% discount ($125/year) and a 14-day free trial with coupon code fallondpicks. What is Invest4Success? A

Markets consolidate Wednesday's gains

Image
My day job kept me away from doing my market review yesterday, but Thursday's action did me favor and ensured there was no significant give-back to these gains.  What was important (for me) was that gains managed to negate the lingering bearish 'black' candlesticks from last week which were casting a bearish pall on recent action in the Nasdaq and S&P - although the Russell 2000 is now starting to struggle a little.  Of the Russell 2000, the index has moved to an underperformance relative to the Nasdaq and S&P and although the index posted strong gains yesterday - which returned it above its 200-day MA - it wasn't enough to negate the bearish inverse hammer. It may be up to other indices to help pull the Russell 2000 higher, but as long as $176 support holds (on any future decline) then bulls can rest easy. 

Sellers attack resistance in the Dow Industrials

Image
Traders booted the juniors off the trading desks following the holidays and they weren't happy.  Selling in the Dow Industrial Average came off the challenge of resistance defined from the last swing high.  The only technical change was the MACD trigger 'sell' but relative strength remained in the Dow's favor.  Look for a move back to the 20-day MA. 

Archive

Show more