Posts

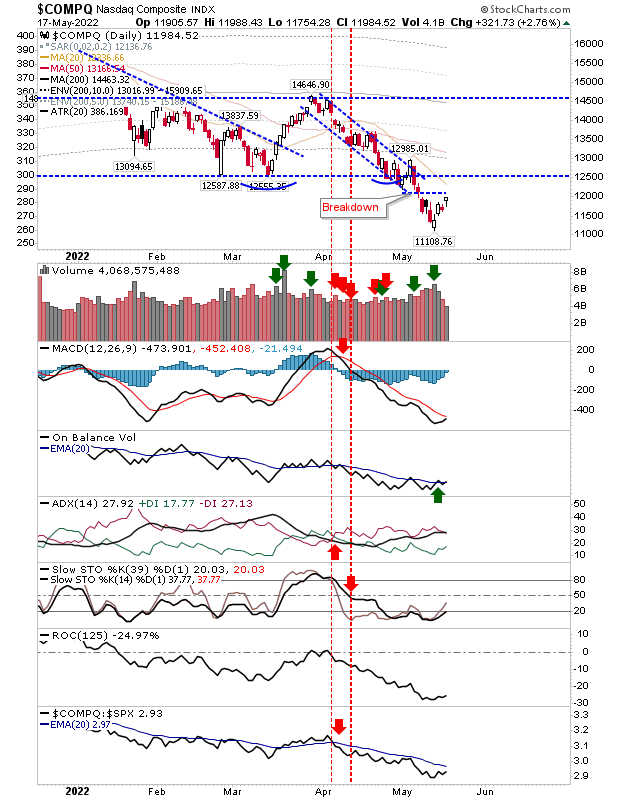
MACD 'buy' signal for Nasdaq and S&P following earlier signal in Russell 2000

Image
We don't want to linger too much on market struggles, but today offered a reprieve to yesterday's selling.  The Nasdaq finished with a gain of just over 1.5% as it attempted a scramble off the lows and avoid a fresh breakdown.  The MACD trigger 'buy' occurred well below the bullish zero line which is not a bullish setup, but I would be more confident if there was a break of the declining trendline. 

Spike low achieved - markets to confirm

Image
Friday's spike lows helped mark an anchor point for a trade worthy reversal. Today's action maintained the sanctity of the spike low as markets failed to close below the prior low, while also managing to finish the day higher. We still have to get beyond the range of what is now looking like a 2-week(+) base, but in an oversold market this is a good place to be.  The Nasdaq is on the verge of a new MACD trigger 'buy' as other indicators remained net bearish.  Confirmation of a bottom will come on a break above 12,000. 

Buyers still have work to do.

Image
Sellers pressured the bounce yesterday and attempted to make amends today, although there is still work to do. The Russell 2000 had the best of the action as it pushed its way back into Tuesday's trading candlestick.  Today's gain came with a 'buy' trigger in the MACD and On-Balance-Volume in support of an acceleration in relative performance against the Nasdaq and S&P.

Bulls gain traction

Image
Buyers were able to maintain the buying from last Thursday with a close at the high of the day across lead markets.  A challenge of the last swing high in early May would set up the reversal rally but there is a couple of weeks work required before markets are able to get there.  For the Nasdaq, we have the 'buy' trigger in On-Balance-Volume with an improving relative performance against the S&P.  The MACD is well below the bullish zero line, so the first 'buy' trigger might not be the one to go for.

Markets make fresh attempt at swing lows

Image
Markets are attempting to build new swing lows from a condition of price extremes both in breadth, and relative to their long term (200-day) moving average.  If we are to get a bottom then we not only need to see gains, but we also need to how markets react on the next loss.  The March swing low started like what we saw on Friday, but when selling emerged buyers could stop it with a consecutive days of buying - at least not until Friday.  On the plus side, On-Balance-Volume is on a 'buy' trigger. 

Market declines continue

Image
With the losses adding up we can start tracking the relative performance of the indices against their 200-day MAs.  We can see from the table below how the relationship of the indices to their 200-day MAs compare historically.   The Nasdaq is 21.6% below its 200-day MA, which puts it into the 5% zone of historic price weakness and is a "Strong Buy".  The S&P is 12.3% is below its 200-day MA, which is also in the 5% zone of historic weakness.  Finally, the Russell 2000 is 18.4% is below its 200-day MA, which is also the 5% zone.  For each index, we are repeating the action of the Covid 2020 sell off, and the Russell 2000 is only a few percentage points away from the 1% zone and a "Very Strong" buy.

Sellers Press Their Advantage But Buyers Hold Long Term Advantage

Image
Whatever hope bulls were hanging on too was quickly quashed by yesterday's gap down and today's trading different bail them out.  The Nasdaq did a little better by closing with an (potential reversal) inside day. A gap higher would offer the possibility for a bullish morning star - not to be discounted as a trading opportunity.  No surprise to see technicals net bearish with momentum oversold.

Archive

Show more