Posts

Sellers Step In As Moving Averages Hold

Image
After days of small gains it only took two days to undo the buying for the majority of August before longs stepped in to recover things by Friday's close. The savior for indices were key moving averages - the 50-day MAs in particular - as traders complacent after easy gains received a bit of a jolt. This isn't a crash, nor necessarily the start of one, but we need to see what happens when indices become oversold and whether they can attract sufficient buyers to take indices out of this condition; if they can't, then the crash sirens will have more credence.  The Nasdaq saw 'sell' triggers in the MACD and -DI/+DI, but stochastics require a few more days of weakness before they can be considered bearish, let alone, oversold. However, the 50-day MA offered a picture perfect support area for Friday's low.

Large Caps Posted Strong Gain But Buyer Beware

Image
After weeks of small gains it was Large Caps in the form of the S&P and Dow Jones Industrials which both posted gains. Large Caps posted gains on higher volume accumulation with strong relative performance against Small Caps. 

Sellers Appear With Volume in S&P But No Conviction

Image
It was looking like an day for sellers to take control but while it was a down day with heavy volume disstribution, there wasn't any significant point loss to go with the selling. Losses in the S&P occurred on significant volume but without any major change in supporting technicals or price. With bulls looking for a crash on any sign of weakness, it`s going to be hard to see a crash occurring as markets continue to enjoy gains on the back of overbought conditions. Crashes do not occur when markets are overbought but when they are oversold, and markets are still a long way from this. 

Rallies Accelerate Without Volume

Image
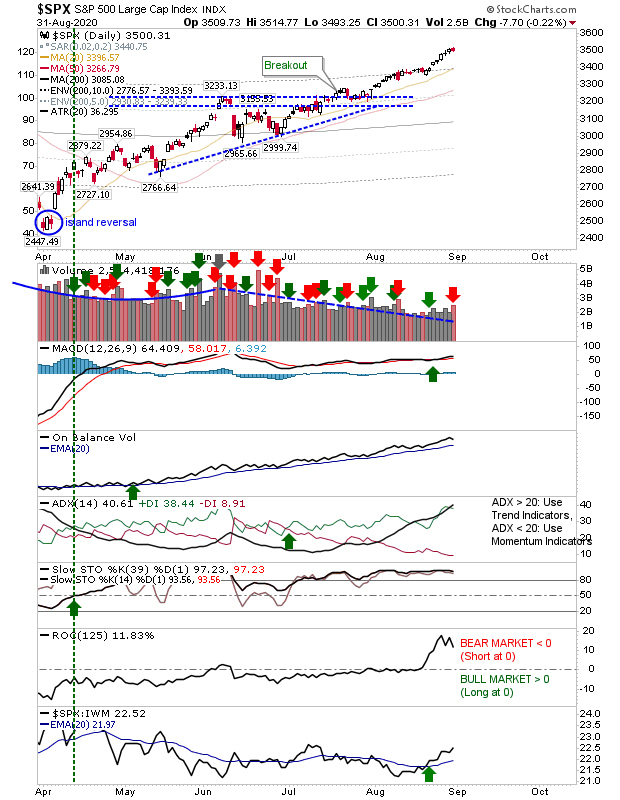
Hard to know what to make of today's action. For Large Cap and Tech Indices there was a pick up in the rate of buying, but the volume to go with the buying was below average - even allowing for holiday (Covid19 holiday) trading. The Russell 2000 didn't manage to post a gain but didn't suffer too much damage. The S&P has moved into the 15% zone and is close to the 10% range of historic overbought price relative to its 200-day MA dating back to 1950.  The last time it was this overbought was February 2020, and before that it was January 2018; both times soon followed by periods of downside (back to the 200-day MA at the very least). Supporting technicals, including relative performance to the Nasdaq and Russell 2000, are strongly moving in bulls favor so we have very little in the way of early warning that weakness is coming so we should pay attention to relative performance to the 200-day MA metric.

Archive

Show more