Posts

Strong finish on Friday for S&P and Nasdaq as Russell 2000 struggles.

Image
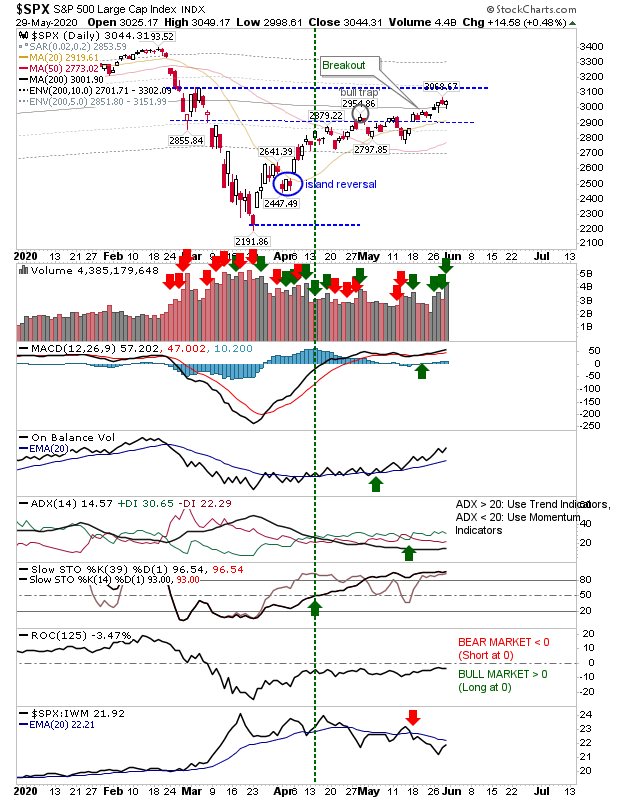
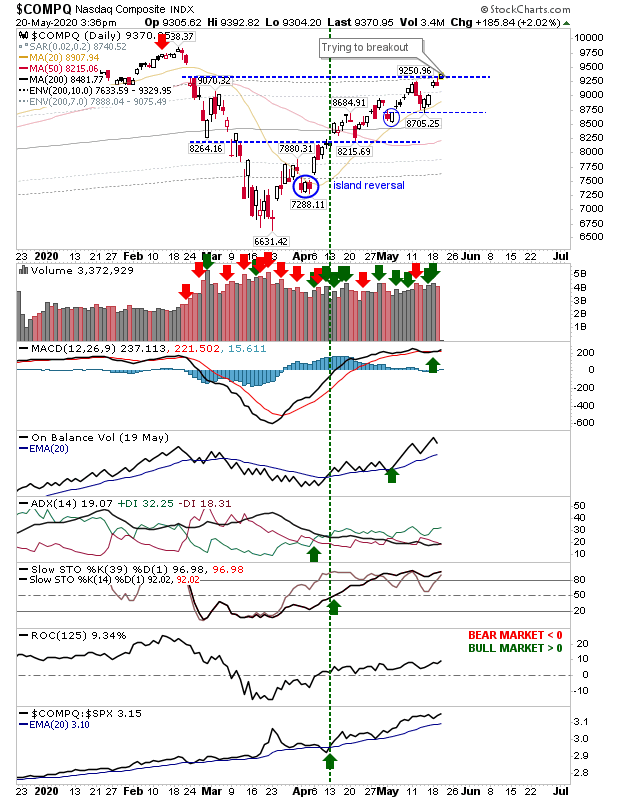
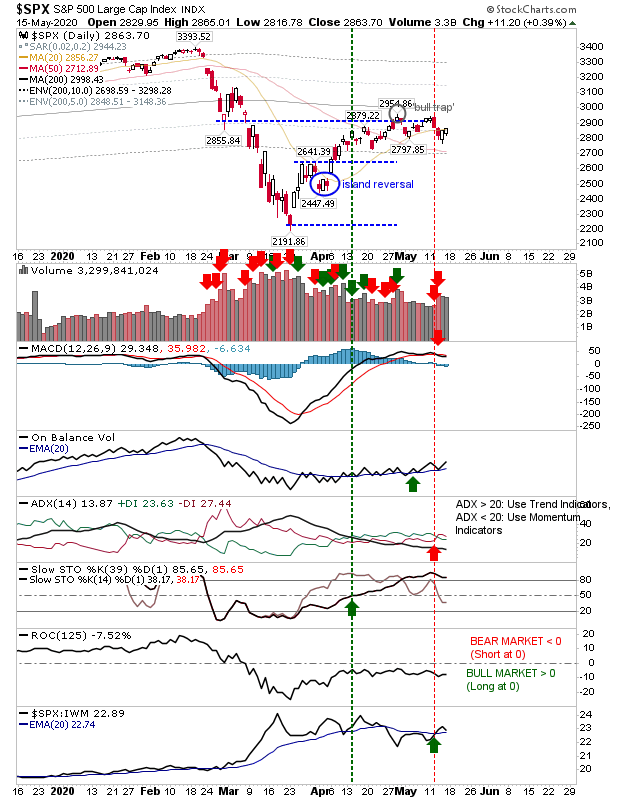
The week closed strongly with volume rising in confirmed accumulation across indices.  The S&P remained above its 200-day MA on increasing accumulation (rising On-Balance-Volume) as relative performance against the Russell 2000.and Nasdaq remained weak. The index remains on course to challenge the mini-swing high from February - a milestone already achieved by the Nasdaq.

Percentage of Nasdaq Stocks Above 50-day MA gets near 90%

Image
Interesting times for markets as breadth metrics which became heavily oversold in March are now becoming heavily overbought on the upside. Ultimately, the heavily oversold condition in March helped create the conditions for the rally - so will the heavily overbought condition go the other way? The Percentage of Nasdaq Stocks above the 50-day MA is well above the peak from January 2020 - and the peak for this metric at any point since its inception; 84.67% was the last peak in May 2003 - but if you consider this, what followed in May 2003 was a continuation of gains for another 5 years, up until the credit crisis in 2008. 

Nasdaq waits for other indices to follow its lead

Image
Investors have been keen to buy tech stocks but there has been a general reluctance to buy into other Large Caps and smaller growth stocks - a few exceptions aside.  The Nasdaq had edged a breakout into the February gap down but didn't fill this gap; typically, when trading enters a gap it usually closes it quickly because there isn't historic supply or demand to stall the action. But this hasn't been the case for the Nasdaq. As a result, the index is sitting on breakout support, waiting for buyers to push things higher. On a positive front, all supporting technicals are bullish. Also, trading volume has remained robust - there is still interest in tech stocks. 

Markets Reach Decision Point

Image
Another resistance level reached - another level to break. The Nasdaq looks to be first in trying to push beyond the level established by the February gap down. If it succeeds, then it will have the upper level of that gap, then only the February high before we are talking of Covid as yet another V-recovery. I think the more likely outcome is a broad trading range, bound by the February and March high/lows. But, for now, buyers don't seem done yet. 

Buyers push gains as challenges remain

Image
A strong start to the week was backed by bullish accumulation across indices. There is still overhead resistance to contend with but today's close was enough to see indices approach breakdown gaps from the Covid sell off. The S&P broke into the 'bull trap' zone but remained pegged to 200-day MA resistance. However, the breakout didn't reverse relative underperformance against the Russell 2000.

Buyers can't reverse week's losses

Image
The week started with losses but the buying of Thursday and Friday wasn't enough to claw back those losses. Buying volume was lighter than earlier selling so there are still doubts traders have the desire to push this to new (pre-Covid) highs.  The S&P does have some bullish markers to work with. Despite the lighter volume buying from Thursday and Friday, On-Balance-Volume is on a 'buy' signal as Stochastics [39,1] are in comfortable bullish territory. The index is outperforming the Russell 2000, but is lagging the Nasdaq. 

Indices fail in their first Advance - A Second is in the Making

Image
Tuesday's action marked the failure for the first challenge of the April swing high; volume climbed to register as distribution as profit takers struck the market in force. Today saw some stabilization of these losses, but buying volume was down on recent selling, so it remains to be seen if this is the making of something more substantial. The S&P is lingering around its 20-day MA. Today's buying ranked as a bullish piercing pattern but the strength of this candlestick requires an oversold condition, which is not the case here.There is also the MACD trigger 'sell' to consider, although other technicals are bullish.

Archive

Show more