Posts

Has the bounce peaked?

Image
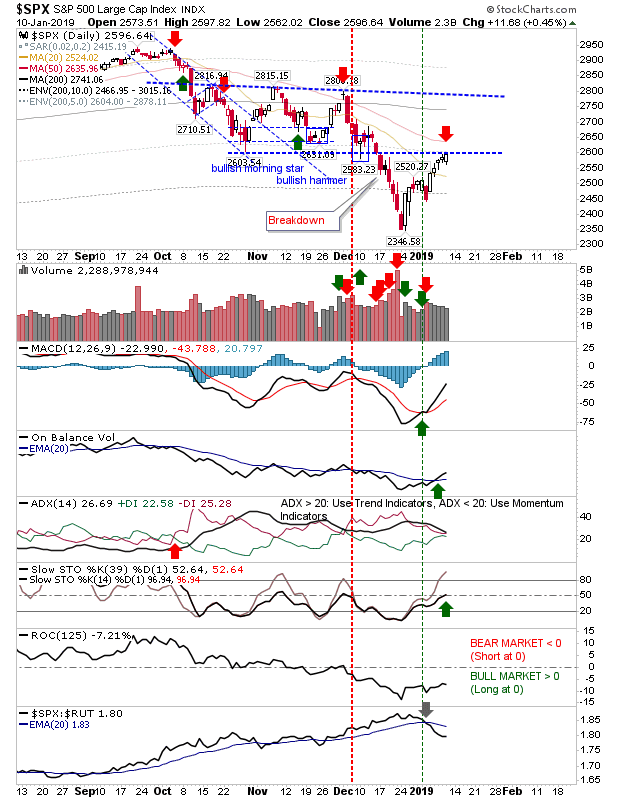
Friday offered a day of tight trading on low volume. Swing traders can take advantage of this by trading a break of Friday's range (buy break of high/short loss of low) and setting a stop on the flip side of Thursday's range (of Friday's if you want to take on less risk). This set-up looks the most logical for the S&P. The S&P again kept to resistance defined by the October spike low and now has the 50-day MA offering some additional resistance. Technicals have edged bullish except the Directional indicator which has been slowing since November; an indication of a possible switch to a trading range. Going forward, I would be looking for a shallow decline, perhaps to the 2,500s, before prices stabilize as a sideways range. Again, look to this a swing trade because if Monday starts brightly and can maintain that strength after the opening half hour it will stress existing shorts into covering their positions and open up for a move to the 200-day MA.

S&P & Dow Jones reaches resistance

Image
Large Cap Indices finished right on resistance from the October and November swing lows; Tech indices had already tagged and breached comparable levels so the expectation is for a breach here too, but aggressive shorts can look to attack here. Stochastics [39,1] are at the 50-midline - the cut-off between a bull and bear market and both MACD and On-Balance-Volume are bullish.

Rally continues as resistance is tested for Nasdaq and Nasdaq 100

Image
Today saw Tech indices start to challenge the swing lows of the November and early December lows. How these indices react will determine how other lead indices will follow. First up is the Nasdaq; today's high tagged this resistance (former support) level. Aggressive shorts will have attacked this area but will be forced to cover if there is a close above 6,855; technicals are mixed, but relative performance (vs the Russell 2000) suggests shorts may still be on the wrong end of the trade.

Strong Friday Finish Negates Apple Bad News

Image
Friday was the finish markets needed to offset the losses from Apple's earlier in the week earnings release. Once again, markets proved resilient in the face of bad news and this can is bullish.  Those who have been buying the oversold (investor) signals can continue to do so. With the move towards the 200-day MA the strength of the investor 'buy' signals weaken; so those buying on the 12-month window can slow to once a month until the next leg down begins. For the S&P, Friday's gain built support for the MACD trigger 'buy' although it lost relative strength against the Russell 2000. Other technicals remain negative as Monday will see its first test of the 20-day MA (soon to be followed by a test of its 200-day MA) and support lows from the October-December period.

Archive

Show more