Posts

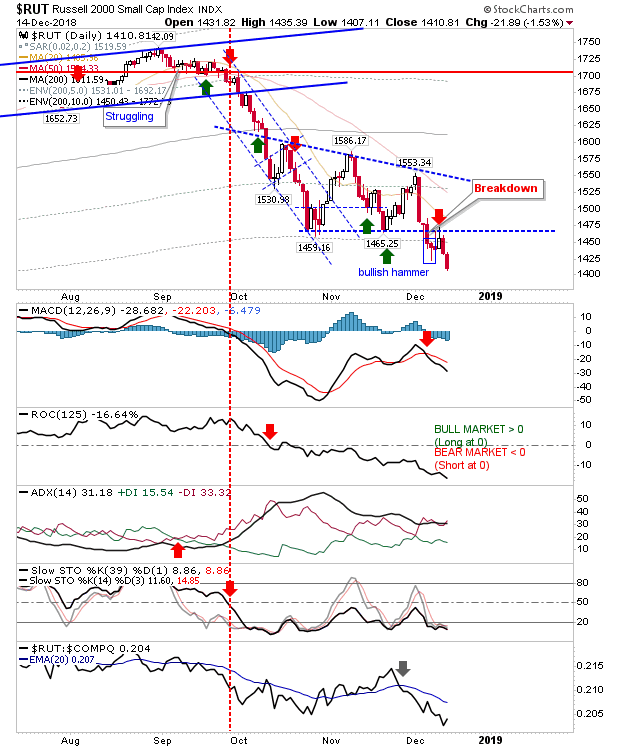
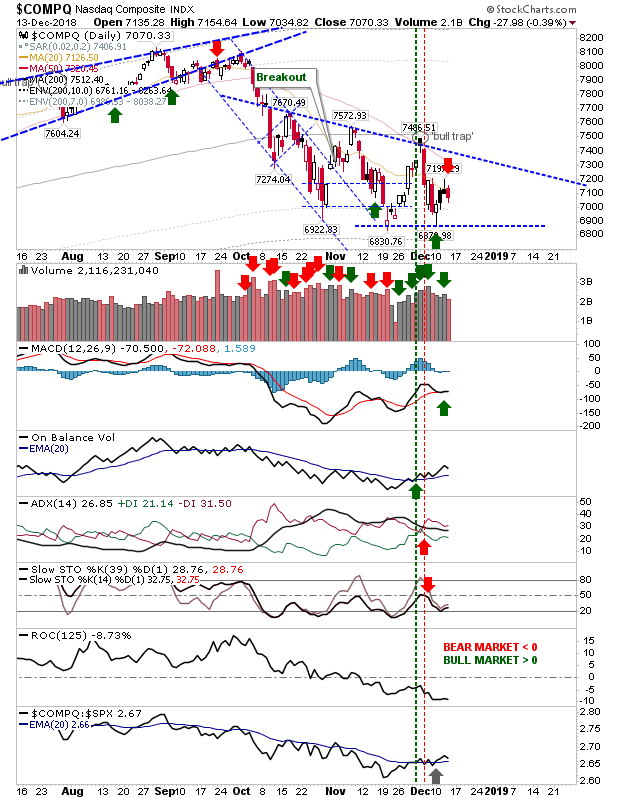
Embrace the Fear - Russell 2000 and S&P in 'Strong Buy' territory

Image
Since my last update markets have taken a bit of a spin. Investors should now take note that both the S&P and Russell 2000 fell into the 'Strong Buy' territory in the move to their respective swing lows.  The Russell 2000 fell as far as 20% below its 200-day MA; note, if it reached 21.4% below its 200-day MA it would be in the 1% zone of historic weak action going all the way back to 1987; like it or not, this is a significant  investor buying opportunity for Small Caps stocks.

Support goes Poof!

Image
Now the panic will start, but Investors should be rubbing their hands in glee. The Russell 2000 has dropped into the 5% zone of historic weakness with the Nasdaq in the 10% zone (S&P unchanged in the 10% zone). Shorts will be happy too but will need to be mindful of snap bear rallies which can quickly clock up 20% gains - and eat up profits (without breaking the broader bearish trend).

S&P and Nasdaq follow Russell 2000 lower on confirmed distribution

Image
Sellers stayed on for another day as it was the turn of the S&P and Nasdaq to follow the losses of the Russell 2000 from Friday.  Volume picked up in confirmed distribution, suggesting there was substance behind today's selling. On the investment front, the S&P moved into the "10% zone" of historic price action (i.e. 90% of S&P action dating back to 1950 was better than what we are seeing now); it's another accumulate buy for those looking to build a long-term investment. The Nasdaq was only 0.4% from doing likewise - completing the history trip back to February 2016.  After that, we are looking at 2008 and 2011 style corrections.

Russell 2000 takes a step lower

Image
While it wasn't the biggest loser on the day, the Russell 2000 did manage to undercut the bullish hammer - ending any chance for a Santa rally of note. Look for this weakness to repeat for the S&P and Nasdaq. The Russell 2000 is still in the accumulate zone for investors and Friday was another chance to add to positions. Again, this may be only the start of the decline but without knowing what may be coming one needs to take chances as they appear.

Bearish cover undermines nascent bounce

Image
Since October's sell-off, down days that racked up losses of 3% or more have garnered much media attention, but the action of the last two days looks a lot more bearish than one of those big sell-off days. The Nasdaq posted a small bearish black candlestick on Wednesday, which was followed by a small bearish engulfing pattern today. Given this followed from an earlier bullish hammer, it now looks like this bounce is losing momentum and another push towards sub-6,800 is on the cards. There is an uptick in relative performance (vs the S&P) but I wouldn't be looking for this to last.

Markets struggle to build on yesterday's bullish 'hammers'

Image
It was a good finish for bulls on Monday but there was a lack of follow through on what should have been a good day for buyers.  However, damage was still relatively light. Technicals for the S&P reverted to a net bearish state as other indices lost ground. The S&P cut into yesterday's spike low but not enough to negate the bullish hammer. I would look for another spike low and would measure risk on a break of 2,580.

Russell 2000 breaks support; other indices to follow?

Image
A tough close for markets on Friday.  The week finished with a decisive break of support for the Russell 2000 which undercut the prior double bottom - this sets of a bad precedent for other indices. There is still a chance for a 'bear trap' but markets will need to recover 1,465 over the next few days - Monday preferably. To add insult to injury, technicals are all net negative and relative performance accelerated lower.

Archive

Show more