Posts

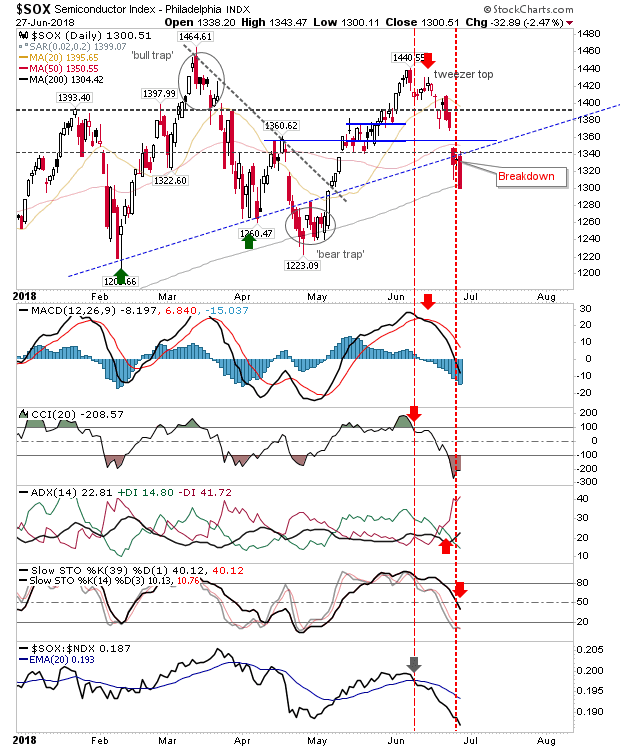
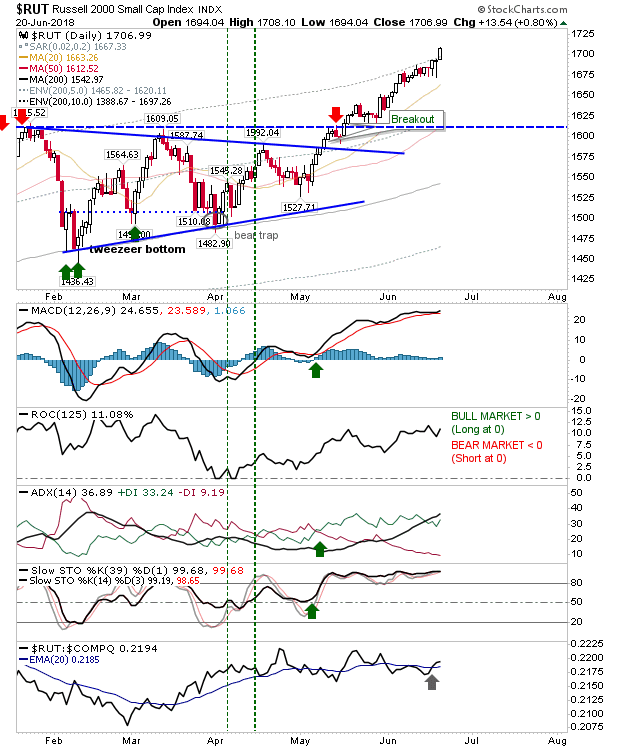
Markets Defend Moving Averages; Good Buying Opportunitites

Image
It was not particularly pretty but it was effective. There was no further drive lower but traders were happy to step in to defend moving averages; those who made the leap were rewarded with an attractive risk:reward opportunity.

Further Selling Hits Markets

Image
Yesterday's respite didn't lead to a bounce, instead, sellers took another swipe at the markets. The worst performer was the Semiconductor Index as it gave up near 2.5% on the day. Today's selling undercut the trendline and finished on its 200-day MA. Technicals are all net bearish but with intermediate stochastics not oversold there is still an opportunity for further losses. Relative performance also expanded on its losses.  The 200-day MA may offer enough traction for a bounce, although given the nature of the sell-off some 'oversell' can be expected.                                                                                                                                                                 

Semiconductor Weakness Drives 'Bull Traps' For Nasdaq and Nasdaq 100

Image
It was worse than expected day for Semiconductors as a sizable gap down and run close to the 200-day MA drove it through many potential support levels. Shorts will be looking to attack the next bounce with a close of today's morning gap the first short entry opportunity (for those who didn't take the 'tweezer top' short).

Semiconductors Accelerate Losses

Image
There was no real change on the end-of-week position of markets. The Semiconductor Index was the most active with an undercut close of the week's swing low Next support level is the 50-day MA.

Large Caps Feel the Heat as Semiconductors Struggle

Image
Yesterday, Small Caps led the rally as Large Caps lost ground. Today, those same weak Large Caps took another hit and dragged Tech indices with them.  Small Caps also suffered but they have plenty of wiggle room before they hit trouble. The Dow sell-off didn't stop at its 50-day MA and is now on course to test its 200-day MA. Technicals, aside from Stochastics, are bearish.

Small Caps Add To Gains

Image
Good news for momentum traders as the Russell 2000 continued its good run. The Russell 200 will start to get hot when it gets into the 15% profit take zone at 1,732 - a zone last seen tested in December 2016; if we are looking at February 2011 levels (the 5% historic zone) then the Russell 2000 would be tagging 1,813. Start taking profits, or sell covered calls, when we get into these levels.

Bulls Look To Make a Stand

Image
It's looking a little early for some of the nascent pullbacks but buyers are stepping in here to support markets. Much of this looks to be driven by the secular bull market leader, Russell 2000. It managed a new closing high as momentum traders continue to benefit from strength in this index.

Archive

Show more