Posts

Bulls Try To Stabilize Market

Image
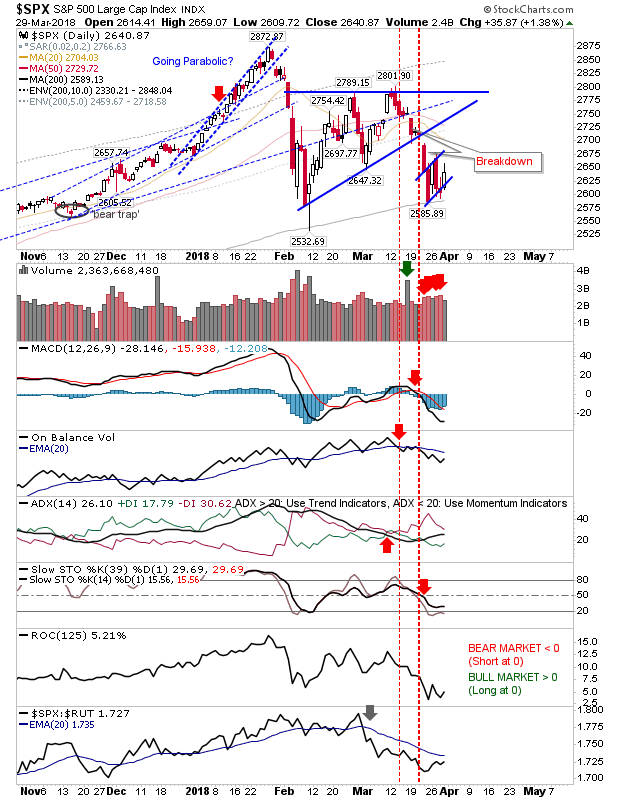
Tuesday's sell-off did much to rattle the confidence of bulls; Thursday's attempt to bid markets back to Tuesday's highs lacked confidence as demonstrated by the relative gain and the lighter volume. Friday is an opportunity to give markets a little boost heading into the Easter weekend.  Futures suggest a positive open so it will be a question as to whether markets can build on it. The S&P is still shaping a 'bear flag' on the bounce off the 200-day MA. While technicals are net bearish they are not oversold.

Tech Indices Finally Succumb to Large Cap Selling

Image
The Media blamed Facebook for today's woes but really the damage was done in January when Large Cap indices sold off and today was the turn of profit takers to take a shot at those high flying Tech Indices. Markets still are a long way from the oversold conditions of February 2016, November 2011 and October 2008; tracked in the tables at the end of this post. I'll let you know when you get there and you can back up the truck for those long-term investment opportunities when it happens. However, my #sectorbreadth analysis is showing near-term buying opportunities. Of the indices, yesterday's little rally looks to have caught out some over-eager buyers, some of whom may have bailed already. For the Nasdaq and Nasdaq 100 there was a big hit with a wipeout of yesterday's gains but volume didn't rank as distribution despite the extent of losses. Technicals, did however, turn net bearish.

Can 200-day MAs Save Large Caps?

Image
Thursday and Friday left no doubt as to which side had control of the market. Rallies are now likely to be sold into given the distance from highs. At this stage, the tone for November's mid-terms has likely been set with January highs unlikely to be tested prior to the elections. However, it's not all bad news for longs. The S&P finished right on its 200-day MA. The likelihood is there will be some follow through lower but if buyers can bid this back up to the close of business (creating a doji or 'bullish hammer') then there is a good chance for a swing low. The best example is the S&P.

Stall in Decline

Image
The good news for bulls was the lack of follow through on the selling. An argument could be made for bullish harami doji in some key indices with stops on a loss of yesterday's lows.

Bears Take Control

Image
More decisive action from bears today as markets lose support.  The S&P undercut the rising trendline and 20-day plus 50-day MAs in a move which looks like it could develop into a test of the February spike low and the 200-day MA again; support at 2,695 is looking critical here. Aggressive traders could look to buy at these levels but confidence in this holding would not be high.

Expiration Spikes Volume but Markets Flat

Image
There wasn't much to be said about the gains or losses from Friday but volume spiked which disguised the intention of either bulls or bears. Friday's flat action probably best suits bulls as it marks a stall in selling losses. The S&P is resting on rising support with just On-Balance-Volume on a 'sell' trigger.

Selling Extends For A Third Day

Image
Indices extended loses for a third day but didn't change the picture from yesterday.  The S&P is still sitting on a support level of the former channel as On-Balance-Volume extended on yesterday's 'sell' trigger.

Archive

Show more