Posts

Counter Break of Consolidation

Image
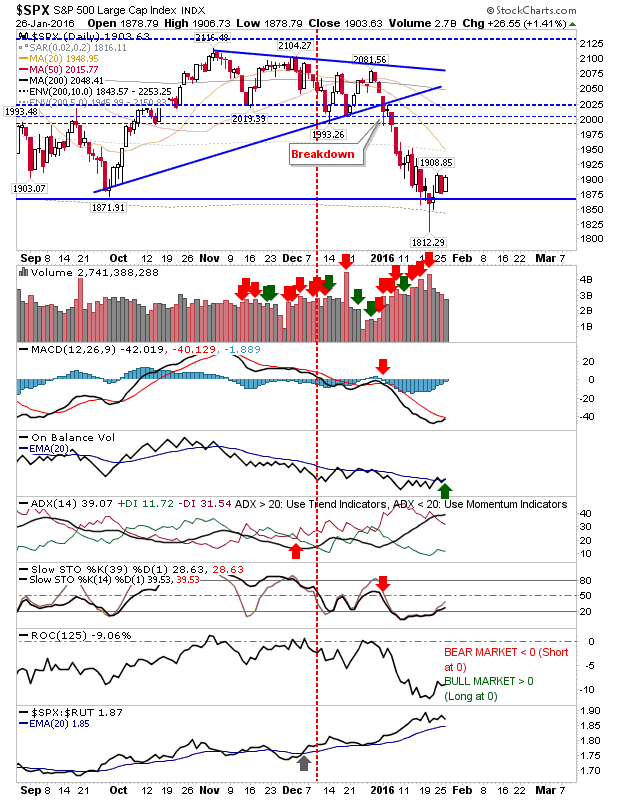
Markets were setting up for a push lower, but Friday's upside break from consolidations triggered a wave of buying (and short covering). The buying was accompanied with higher volume accumulation. Shorts were left squealing by Friday's action, and new shorts will need to wait until Nov-Dec consolidations are tested before new positions are entered. Until then, short covering and long buyers rule the day. The S&P has taken the first step of a rally to take it back to the supply zone of 2,000. Friday's action was accompanied by a MACD trigger 'buy' and On-Balance-Volume 'buy' trigger.

Market Consolidations Continue

Image
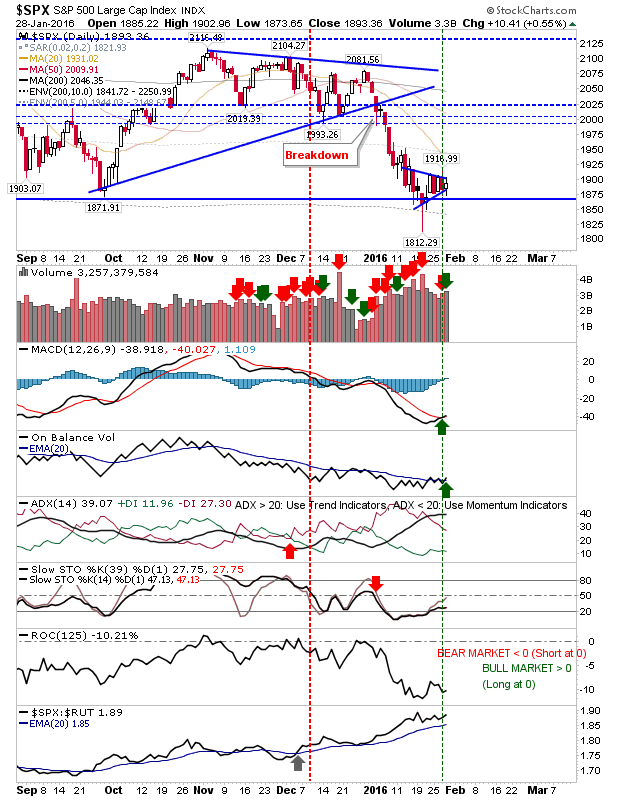
The consolidations developing in the market remained in play by the close of today's business. Volume climbed in confirmed accumulation, which is a potential sign for an upside breakout from these consolidations. But with bearish lead-in trends, any upside breakouts will quickly run into supply issues from Christmas consolidations. The S&P is shaping a pennant just above support from September/October swing lows. There is a weak 'buy' in the MACD and On-Balance-Volume.

Consolidation at Support Suggests Breakdown Favoured

Image
The back and forth in the markets continued as yesterday's gains were undone by today's higher volume selling. The concern with today's action is that the consolidation in the S&P has the look of a bearish continuation wedge. And given the potential for a measured move, it opens up the possibility for a push down to 1,650s. A weak 'buy' signal in the MACD could trap more bulls.

Good Recovery

Image
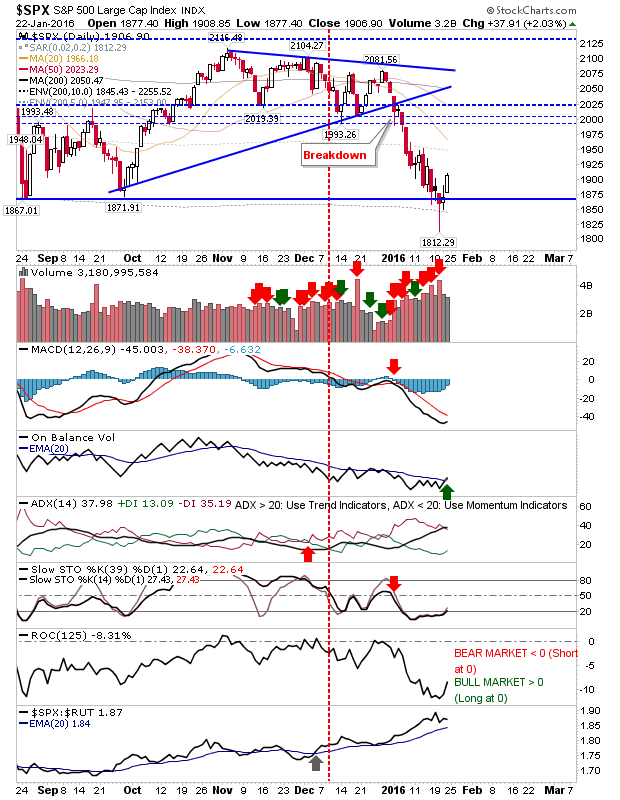
Monday's close had all the look of a retest of last week's spike low. And the Asian session only looked to confirm further weakness as the Chinese market continued its slump. However, bulls kicked off from the open and clawed back most of yesterday's losses. In the end, markets are nicely placed for tomorrow, having undone the damage of yesterday. The S&P still has a 100 point buffer before it gets to supply issues.

Friday's Gains Reversed

Image
Start Here You've now read my opinion, next read Douglas' and Jani's . It looks like longs weren't prepared to wait for a test of Oct-Dec trading ranges before dumping their positions. Instead, longs took advantage of nascent strength to sell existing positions. If there was a bullish take from this, then it's that selling volume was lighter, which may give bulls something positive to hold on to. What today's action suggests is that a move back to last Wednesday's spike lows would appear to be necessary to firm if support - if such support exists. Unfortunately, such a test would break up September's low as trading range support, and open up the possibility for a measured move lower (i.e. the height of the Sep/Oct - high/low differential, projected lower).

Nascent Swing Low

Image
Friday did enough to confirm Wednesday's spike low as a potential Swing Low. Markets may look to rally back into the Oct-Dec trading range, but getting beyond that may prove more of a challenge. But until then, is plenty of room to support a low volume rally. For the S&P, there is a thick level of support from 2,000 up to 2,025. Beyond that, things quieten with the 200-day MA, then a successive level of swing highs. Technicals remain in bears favour, although there was a 'bull' cross in On-Balance-Volume.

Capitulation?

Image
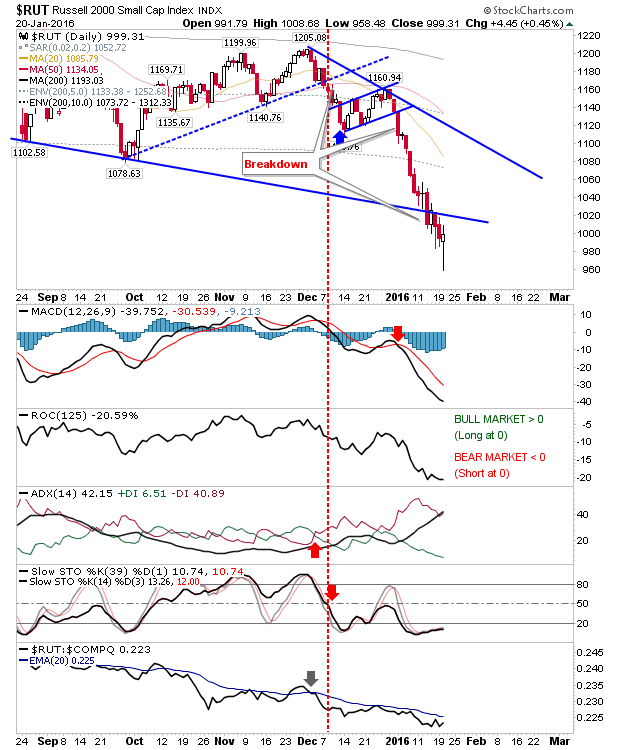
Today offered the first real sign some form of capitulation kicked in. Volume was perhaps a little tame (although higher), but markets have reached a point where a short term bounce could be in the making. What may be of greater interest is what happens once we confirm a bounce is in effect. I suspect buyers will be reluctant to push prices beyond the November/December swing lows. The Russell 2000 is the index which has suffered the greatest losses over the past few weeks and it was the first index to finish with a gain. The bullish 'hammer' is a bonus and today's intraday range included the 25% loss from all-time peak to current day lows. We have long since passed the period of historic weakness relative to its 200-day MA (deep inside the 5% zone of historic weakness).  While today doesn't feel like a low-low (only a hunch), it's still likely to mark a trade-worthy low, much like August's and September's lows last year.

Archive

Show more