Posts

Small Caps Continue To Feel Pain

Image
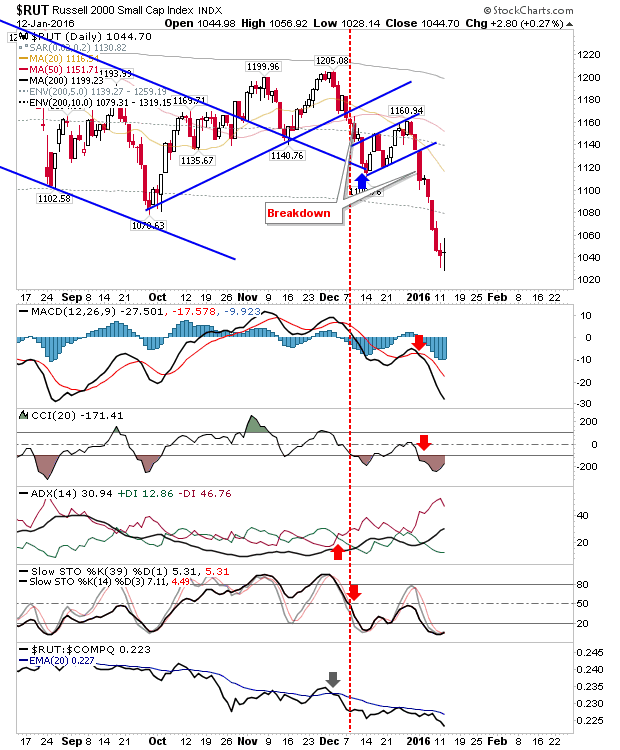
It was an odd day. Early gains were quickly erased, but some markets managed to regain some lost ground by the close. The Russell 2000 experienced the worst of the action and is finding it hard to attract buyers. The next milestone is the 25% discount from highs at 972, then the measured move lower at 951.

First Derivatives Seeks New Hires

Image
If there are readers out there looking for a change in scenery in their jobs, First Derivatives (my employer), are looking for candidates.  They have offices in the U.S., Ireland, U.K., and Australia. If interested, I can refer you to HR if you send on your CV to me, and an email detailing what role you would like to fill and why to dfallon(@)firstderivatives.com The available roles i n summary are: London / New York/ International Based Roles ·         Java Developers ·         C# Developers ·         Vendor SME’s – Murex, Calypso ·         Business Analysts / Technical Business Analysts ·         Programme/Project Managers ·         Experienced Support Analysts ·         Test Analysts Newry / Dublin/ Belfast Based Roles ·         Business Analysts / Technical Business Analysts ·         Experienced Support Analysts ·         Client On Boarding ·         Test Analysts ·         Java Developers ·         C# Developers The company website is her

Markets Down But Volume Picks Up

Image
What had looked like a swing low on Thursday was quickly undone in early action Friday. While traders looking to trade a short term bounce were burned, those looking for long term opportunities were rewarded with further discount. There wasn't any change in the long term bottom watch. The S&P almost reached the 5% percentile of weak prices, last seen in November 2011.  Likewise, the Nasdaq is close to the 10% percentile, while the Russell 2000 is already in one of the weakest periods it has experienced since 1987. This doesn't mean prices can't go lower, but if you have a hold time period of years there is value to be found in Small Caps stocks. The last time markets were this oversold was in 2011, and 2008 before that.

Better Action From Bulls

Image
After yesterday's finish it looked easier for markets to continue lower, and early action had suggested this might have been the case. A weak finish put a bit of a damper on things, but there is something for bulls to work with. Volume didn't register as accumulation, which was disappointing and would have helped defining a capitulation - which doesn't look to have happened yet. The Nasdaq had the best of the action. A bullish harami after new lows offers a suggestion for higher prices tomorrow. The problems for bulls will start if the index makes it to Oct-Dec congestion zone and/or overhead moving averages.

Sellers Strike Back

Image
Where for most of 2015 bears often found themselves on the back foot with days of selling undone by one big buying surge, now bulls are finding themselves having to step up at a time when shorts are in control. Today was an ugly day. In terms of relative performance, the S&P has dropped into the 10% percentile of bearish prices dating back to 1950. There was little positive to say on the day. Given the rate of decline, the chances for August/September lows holding as support look slight.

Bulls Attempt A Defense

Image
It wasn't a decisive victory for bulls, but at least buyers were able to push markets into a higher close. For some markets, the end result was still indecision as to whether this marks a potential swing low. And in all markets, volume was lighter than yesterday. The Russell 2000 was the index which had taken the biggest relative loss, and consequently, had the most neutral finish with a wide-range day doji. There was a small uptick in technical strength, with the exception of relative performance against the Nasdaq (and S&P), which ticked lower.

Markets create spike lows

Image
It was a mixed bag for markets.  Large Caps probably had the best of the action; the Dow closed a little higher while the S&P pushed a spike low. The S&P did tag the 10% percentile of historic low prices going back to 1950, while technicals remain firmly negative. Today's doji marks indecision and makes tomorrow a 50:50 play. Should markets continue to fall then August/September lows will appear to be a minimum test.

Archive

Show more