Posts

Small Caps take the brunt of selling

Image
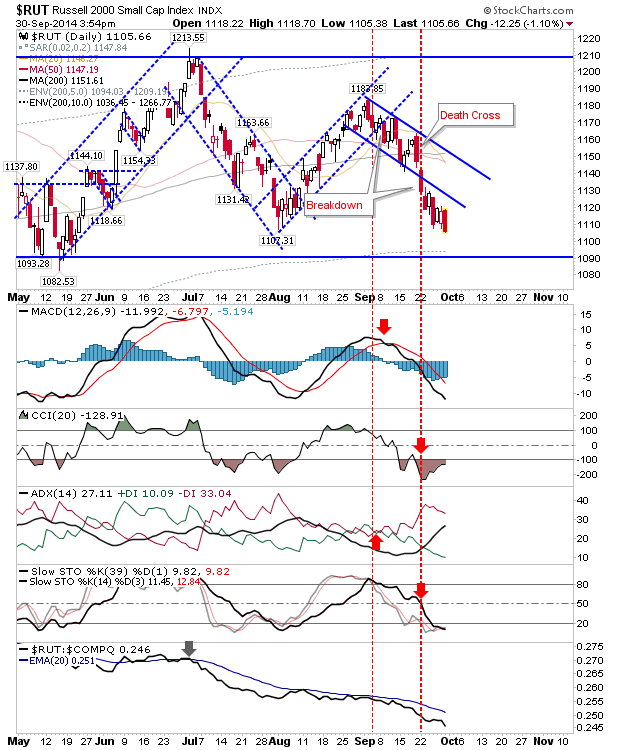
The aversion to risk continued with Small Caps edging a break below the July swing low on a loss of nearly 1.5%. However, the larger trading range is intact until 1,090 is lost. The 200-day MA is also nearby to lend support. As for today's action, more selling is favored for tomorrow, although action in other indices isn't pointing so bearish.

Friday's Bullish Picture Holds Despite Mild Selling

Image
Friday's buying volume was disappointing, but indices held on in the face of today's distribution. Today's lows mark the new support level for stops, although moving averages are also playing as a broad brush of support. The S&P finished with a doji on its 50-day MA.  Technicals remain mixed with a bearish slant in MACD, On-Balance-Volume, and ADX, but with momentum on the bullish side.  The index is tied below 1,987 resistance, but is positioned for a challenge of this level tomorrow.

Daily Market Commentary: A Recovery Lacking Volume

Image
It was a noble effort on the part of bulls, but it lacked the volume to really pressure bears.  However, Friday's action did offer bulls something to work with on Monday, while bears have one option to play with. The Nasdaq is working on a possible 'bear trap' with a return above the 50-day MA, and a close above 4,485. Risk is measured on a loss of 4,475.

Daily Market Commentary: Reversing Yesterday's Gain with a Bigger Loss

Image
It proved to be an ugly day all around. Yesterday's recovery rallies were quickly taken out with today's heavy losses. Attempts to find support at 50-day MAs and/or channel support were pushed aside. However, these losses have some way to run before August swing lows are challenged. The S&P could look to mount a new rally, although I suspect it will struggle to get close to 1,987.  If it can't move above its 50-day MA, or finds resistance near this moving average, then shorts will have an entry opportunity for a push down to August swing lows and/or 200-day MA.

Daily Market Commentary: Bullish Engulfing Pattern in S&P on 50-day MA

Image
An important day for the S&P when a successful test of the 50-day MA was combined with a bullish engulfing pattern.  Better still, the index was able to finish above 1,987, a key support level. Technicals are seeping negativity, but not enough to be outright bearish.

Daily Market Commentary: S&P Possible 'Bull Trap'

Image
It's perhaps a bit of a reach, but the S&P closed below key 1,987 support in what could turn into a 'bull trap'.  What makes the 'bull trap' a tenuous conclusion is the 3 day decline required to get it there. Also, the index hasn't yet tested its 50-day MA, this should be an area of demand.  Technicals are developing bearish, but are not net bearish. Bulls will have another opportunity at the 50-day MA which could see a test tomorrow.

Daily Market Commentary: 'Bull Trap' Confirmed in Semiconductor Index

Image
The failed breakout in the Semiconductor Index expanded with another loss above 1%.  Monday's loss took it below the 20-day MA, kept the MACD 'sell' trigger in play and generated a CCI 'sell' trigger.

Archive

Show more