Posts

Daily Market Commentary: Weak Rally

Image
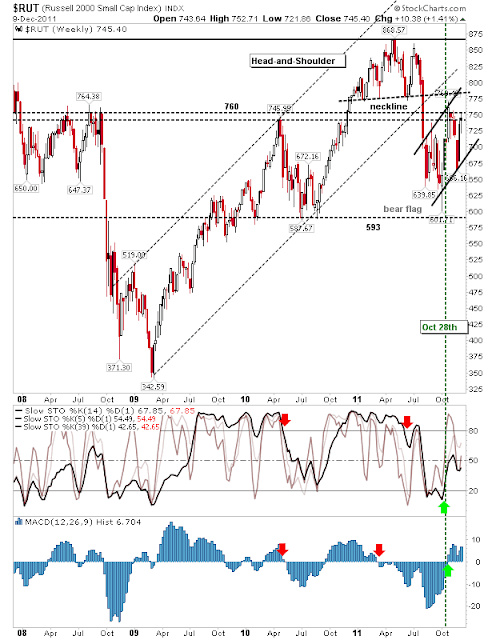
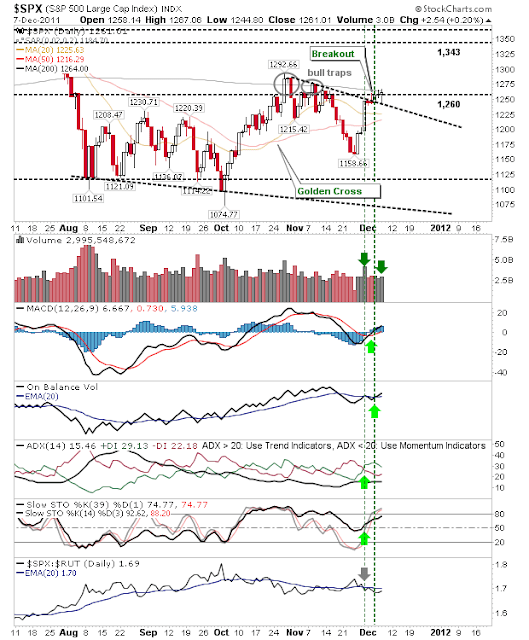
It could have been so much better after a bright start gave way to apathy and a disappointing close. There is a great deal of reluctance on the part of sidelined bulls to step in and bargain buy. In such an environment markets typically drift down in the absence of buyers, irrespective of active selling in the market. If sellers do pick up the pace it could be a whole lot down, although with indices near oversold territory it might just be a brief collapse. The S&P managed to rally to newly established resistance at converged 20-day and 50-day MAs, but had eased back by the close. Volume was down, which will offer some comfort to bulls (but probably not much). The November swing low continues to call... The Russell 2000 also managed to do just enough to take it to 20-day and 50-day MAs, but achieved little more. Stochastics switched to a 'sell' trigger as Thursday's finish left the index well positioned for a short attack. However, a strong push above the 20-da

Daily Market Commentary: Technicals Net Bearish

Image
Another day of selling stuck the bearish knife deeper into markets. Some markets fared worse than others; one of the hardest hit was the semiconductor index. The November breakout gap closed yesterday, but today the semiconductor pushed towards the November swing low. It was accompanied by expanding weakness in its technicals. Troubles in the semiconductor index continue to manifest in the Nasdaq and Nasdaq 100. There was no surprise to see the November breakaway gaps close for the Nasdaq and Nasdaq 100, with the Nasdaq doing so on heavier volume distribution. Technicals turned net negative following the MACD and Stochastic 'sell' triggers. Will both these indices continue lower as the semiconductor index has. The S&P lost support of its 50-day MA as a 'Death Cross' triggered between 20-day and 50-day MAs. To add to the misery, technicals turned net bearish with MACD and Stochastic 'sell' triggers. The Russell 2000 also saw a worrying break

Daily Market Commentary: Fed Forces Bulls Hand

Image
While bulls saw the best of the action in premarket trading it was left to the Fed to finally kill any residual challenge on 200-day MAs. Any buyer using a stop on a loss of the 3-day low would have been knocked out in the last hour of trading. Adding to the trouble was a couple of breaks on supporting Moving Averages. Tech indices and the S&P also saw confirmed distribution - Santa has taken a hit to the chest. The S&P was able to cling on to 50-day MA support, although technical weakness expanded; there were 'sell' triggers in On-Balance-Volume and Directional Index, offset by the flight to safety of Large Caps over Small Caps. The Nasdaq had problems of its own with a bearish engulfing pattern, a break of the 50-day MA, and a 'Death Cross' between 20-day and 50-day MAs. This leaves the gap at 2,533 as the next target for the index. The Russell 2000 was caught in the middle. It has yet to experience a 'Death Cross' or break its 50-day MA, b

Daily Market Commentary: Moving Averages Hold as Support Despite Losses

Image
The struggle between bulls and bears continued Monday as Friday's buying was reversed, bringing indices back to the lows of last Thursday's selling. However, volume was lower, so there was no distribution and key moving averages held as support. While indices haven't broken above 200-day MAs they haven't turned away either; buying pressure on this key moving average is likely to lead to upside breaks across the indices as part of the 'Santa Rally' effect. The S&P held its 20-day MA despite a brief intraday violation. Relative strength swung away from Large Caps towards Small Caps; although whipsaw has been an issue in recent weeks. The Nasdaq dug in at the 50-day MA as it's about to lead against the S&P since early October. In the meantime the 'bull trap' marked by 2,616 remains. The Russell 2000 is also suffering with a 'bull trap' as today's finish held the 20-day MA. For Tuesday, bulls can play a long position

Weekly Market Commentary: Little Change on Week

Image
Markets had a bit of a roller coaster week on continued shenanigans in Europe, although the net effect was to see little change on the week. The Russell 2000 got close to 760 resistance as technicals improved. The index continues to trade inside the potential 'bear flag'. The Dow was able to push a little more given resistance is a couple hundred points away - namely declining resistance from the early 2011 swing highs.. The S&P also offers room to the upside. But... S&P market breadth exhibited a 'bull trap', which suggests lower prices! Despite the 'bull trap' in the NYSE Summation Index the rising price trend remains dominant for the S&P and others. Look for another week of gains until declining resistance created by April and July swing highs becomes more of an issue. ---- Follow Me on Twitter Dr. Declan Fallon is the Senior Market Technician and Community Director for Zignals.com . I offer a range of stock tradin

Daily Market Commentary: Bearish Pressure

Image
Markets finally succumbed to bearish pressure after days of resilience around 200-day MAs. This has created fresh 'bull traps' for some indices, a concern in the face of prior supply and a potential catalyst for larger declines in these indices. A decent rally would again negate these 'bull traps', but another down day would effectively confirm these areas as supply. The S&P is the index best positioned to recover from today's sell off.  Technicals are still positive and relative strength has swung in its favour ahead of Small Caps. The prior resistance level is still close enough to be considered support and the 20-day and 50-day MAs are just below to provide additional assistance. The Nasdaq closed below 2,616 support but finished on converged 20-day and 50-day MAs. Volume climbed to register a distribution day which was enough to generate a 'sell' trigger in On-Balance-Volume. Bulls have very little room for maneuver on the downside, but a 1% g

Daily Market Commentary: Decent Recovery Into Market Close

Image
Morning action had suggested 200-day MAs had finally proven to be a step too far for the indices, but a late day recovery placed the pressure back on these key moving averages. Certainly, there is strong indication 200-day MAs will be broken to the upside. The S&P found support at the back test of declining resistance turned support. Volume climbed to register an accumulation day as the index also finished above 1,260 support. The Nasdaq is similarly poised, although there is a far greater level of tension between rising 50-day MA support and falling 200-day MA resistance; look for this to sharply resolve one way or the other - should be a good trade (likely to the upside). The Russell 2000 is the loosest of the indices in that it's neither near 200-day MA resistance or 50-day MA support. Therefore it may lag in response when the break finally comes in either the Nasdaq or S&P. For tomorrow, look to Futures with the S&P likely to lead the 200-day MA bre

Archive

Show more