Posts

Daily Market Commentary: Quiet Day

Image
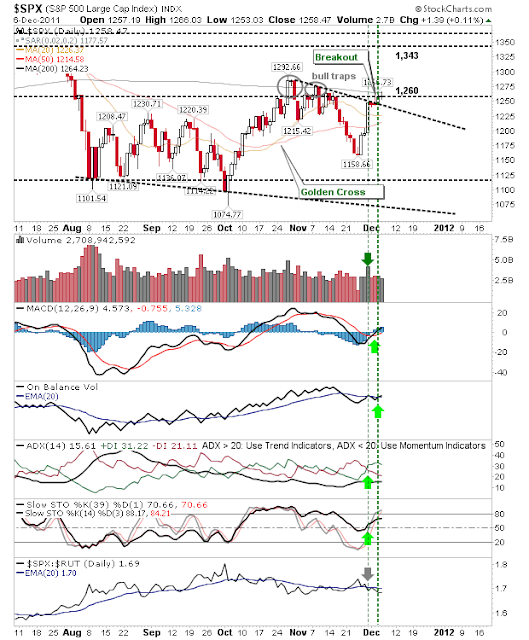
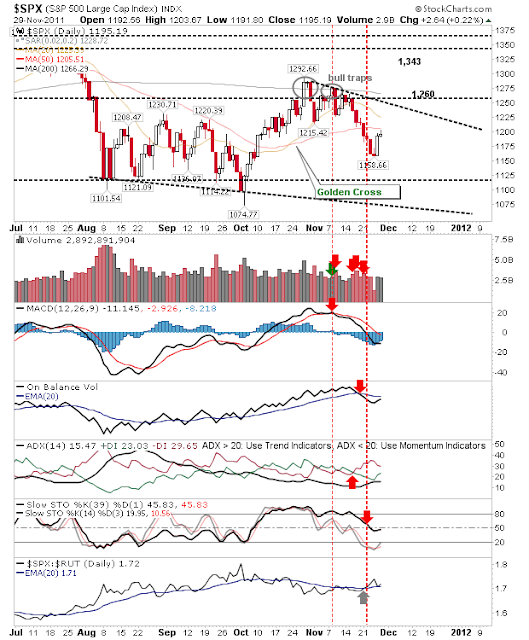
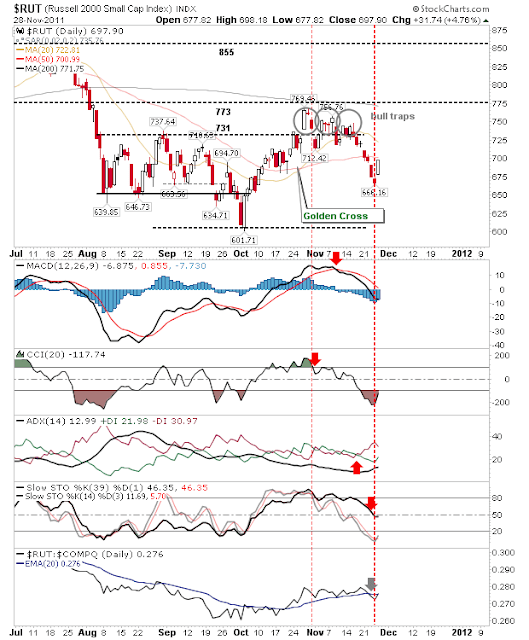
There is very little to say about today that wasn't covered yesterday. Markets were unchanged - in fact, today's narrow range may be used to enter a trade on a break of the day's high/low with a stop on the flip side. The presence of 200-day MA resistance probably gives the edge to bears - but there are 'Buts' The S&P is a case of mixed emotion; 200-day MA resistance, but a bullish breakout from declining resistance. Technicals are bullish for lead indices And market breadth continues to improve So if 200-day MAs are broken to the upside it may offer grounds for another decent step up for this rally. -------- Follow Me on Twitter Dr. Declan Fallon is the Senior Market Technician and Community Director for Zignals.com . I offer a range of stock trading strategies for global markets which can be Previewed for Free with delayed trade signals. You can also view the top-10 best trading strategies for the US, UK, Europe and Rest-of-the-Wo

Daily Market Commentary: Technicals Turn Net Bullish

Image
While indices gave up some of their intraday day gains by the close of business, there was a more bullish turn in the technical picture of each. The S&P had the best of today's action. There was a break of declining resistance on modest volume, but it wasn't enough to break 1,260 resistance. The Nasdaq finished with a potential bearish 'shooting star' just below 200-day MA resistance. Volume climbed a little to register an accumulation day. Can tomorrow see the break of the 200-day MA? The Russell 2000 pushed inside prior trading of the 'bull traps', but unlike the S&P and Nasdaq, has room to go before getting to its 200-day MA. The semiconductor index finished a couple points below 381 resistance, but it too saw a net bullish turn in technicals. What this means for tomorrow is more difficult to decipher. Indices are positioned at resistance, be it 200-day MAs or a horizontal price point, so lower prices are favoured in the short te

Weekly Stock Market Commentary: 'Bear Flags' Broaden

Image
Last week's stellar rallies redefined the boundaries of 'bear flags' on the weekly timeframe. This a mix of good and bad news. On the good news front, it leaves the indices well positioned to continue the gains of last week. The bad news is that it doesn't negate the broader bearish implications of the pattern; although some indices are better positioned than others to capitalize. The Russell 2000 is one index which has a number of key resistance areas to negotiate before it can move clear of trouble. The index managed a huge 10% gain on the week, but it closed below 760 resistance with a more significant level at 775; the neckline of the early year (bearish) head-and-shoulder pattern. Bulls need a decisive push above 775 to prevent shorts from building positions at these key resistance levels. The Dow is one of the better positioned indices. While it's still bound by the 'bear flag' it has pushed itself into early-year congestion, negating the head-a

Daily Market Commentary: Little Change

Image
Not a whole lot you can say about today. After yesterday's whopper day it was always going to be tough to get a repeat of the buying, but the good news is it didn't give up any of those gains either. The S&P is honoring declining resistance (from the 'bull trap' highs). On-balance-volume switched back to a 'sell' trigger. The Nasdaq was able to push above 2,616, bringing with it a 'buy' trigger in the +DI/-DI and Stochastics. Nasdaq Breadth also improved, although the recovery is not from an oversold position, this may shorten the length of the bounce. While the Nasdaq 100 was able to push above its 200-day MA (not to mention its 20-day and 50-day MAs too), but is still contained by 2,320 resistance. Finally, the Russell 2000 stays pegged to resistance aswell. Because of the minor losses the indices are well placed to push higher and break resistance. Given the influence of European troubles on the U.S. market, futures shou

Daily Market Commentary: 'Bull Traps' Under Pressure

Image
Today's massive rally added about a week's worth of gain in just one day. Volume surged to mark the first true accumulation day since indices broke above 200-day MAs at the end of October. In a rare sequence, it has taken only three days to reverse seven consecutive days of losses. Has Santa made an early delivery? The S&P rallied through 50-d and 20-d MAs to finish at wedge resistance. Above lurks the 'Bull Trap' divider at 1,260. Technicals have seen some significant improvement with bullish crosses of on-balance-volume, +DI to -DI and Stochastics; a great day for the index. To break out of the wedge and above 1,260 seems too much to ask for tomorrow - but it will probably happen pre-market! The Dow was another star performer. It managed to go a step further by closing above its 200-day MA and is very close to taking out the October swing high - continuing the sequence of higher highs and higher lows. Like the S&P it too saw net bullish crosses in Sto

Daily Market Commentary: Little to Report

Image
Yesterday's low volume gain sowed a seed of doubt into the strength of the buying. While expanding technical weakness further tilted things towards sellers. However, today's action didn't see a rush to the exits and trading volume was again light. Moving averages are offering resistance, but a modest gain will be enough to break many them. The S&P was repelled by the 50-day MA as the MACD and On-Balance-Volume builds towards a new 'buy' trigger despite the net bearish technical picture. The Nasdaq gave back intraday gains, but didn't impinge on Monday's premarket gap. It will be important for the gap to hold if 2,441 is to be treated as a swing low of a new rally. The Russell 2000 traded tight around its 50-day MA with very little intraday movement. Swing traders may want to play a break of Tuesday's high/low with a stop on the flip side of today's range. One can't read too much into today - Moving Average resistance is the k

Daily Market Commentary: Day of Contrasts

Image
I had looked to 'Black Friday' as the day we would see the big one-day rally. Instead, Monday (or more precisely, pre-market Monday) was when markets booked their gain. Unfortunately, the gains came at a cost. First up was the Russell 2000. It posted nearly a 5% gain, but it wasn't enough to recover a net bearish turn in technicals. Monday's rally finished just shy of its 50-day MA. The tricky part is the current trading inside August-September congestion. A break of the 50-day MA tomorrow sets up a move to the 20-day MA at 722.81. The S&P also experienced what looks to be a 'dead cat bounce'. Volume was down with the 50-day MA nearby to provide resistance. As with all the lead indices, the August-October congestion range keeps things tricky; although 'bull traps' typically retrace the entire move - and then some. The Nasdaq is also stuck in the Aug-Oct congestion zone. But the concern is not the index, but supporting market breadth indic

Archive

Show more