Posts

Daily Market Commentary: Gain - What Gain?

Image
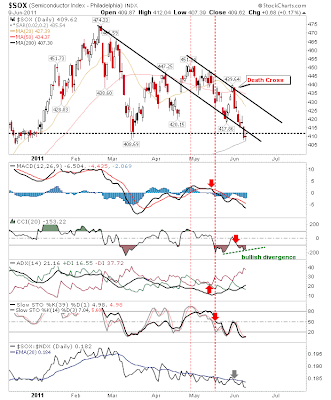
In the game of one-upmanship bears raised the stake once more, pushing indices back to, and in some cases, beyond yesterday's starting prices; each swing becoming ever more volatile. It still doesn't change the situation that a bounce of substance is more favoured in the short term, especially with significant support still available to lean on. The S&P posted a new low for the decline from April highs but it remained above 1,260 and 200-day MA support. Volume climbed to register another distribution day. One only has to look at the chart to see how many distribution days have passed since the April top. Today was ugly, but bulls still have support to work with. The Nasdaq returned to its 200-day MA after yesterday's weak bounce as volume rose significantly to mark a distribution day. Bulls next line of defense is 2,616. But bulls may not find the 200-day MA of the Nasdaq so forgiving. In the Nasdaq 100 the 200-day MA was cleanly sliced as it finished on March s

Daily Market Commentary: Recovery Bounce Begins

Image
A second attempt at a swing low kicked off with respectable gains on modestly higher volume across lead markets. The S&P rallied back to the gains posted last Thursday. The three day sequence completed a 'bullish morning star' which leaves it poised for further gains. Unfortunately, there are a number of supply levels to overcome, first of which is 1,294, then 1,305, followed by the 20-day MA. The semiconductor index managed to test its 200-day MA but lost some of its gain by the close of business. Work to do but bullish divergence in CCI remains. First step remains a push above its 200-day MA before other resistance levels can be considered. The Nasdaq gapped higher on lighter volume. The gain was enough to confirm a defense of the 200-day MA but minor resistance can be found at the April swing low at 2,706. Finally, the Russell 2000 enjoyed the largest gain. Small Caps jumped over 2% as it worked off converged support. Relative strength swung to outperform Tech

Daily Market Commentary: Support at 200-day MAs

Image
Friday's whitewash of an attempted bounce was followed with a positive test of 200-day MAs. Of those testing this key average, the Russell 2000 may offer the best buying opportunity off today's close. First up is the Nasdaq. It posted a picture perfect touch of the 200-day MA at the day's low. Selling volume lightened - another positive, although the March reaction low is still a couple of day's selling away. The Nasdaq 100 also tested its 200-day MA and is only a few points away from the March swing low. The Russell 2000 is best positioned to take advantage of a 200-day MA test. Today brought a test of the January swing low with the 200-day MA only a few points below. Buyers might take an interest in this index tomorrow. The S&P has room to maneuver down to its 200-day MA and the March swing low. Of all the indices it's in the best position to absorb another day or two of losses and still offer a long side opportunity. The index most in trouble -

Weekly Market Commentary: No Great Change

Image
The dailies look ugly but markets haven't pushed themselves over the edge on a weekly timeframe. The Nasdaq 100 is the best positioned of the lead indices but it will likely be dragged down by weakness elsewhere. It's the only index trading above 2007 highs. The index is above 2,217 support with a working band in the 2,130 to 2,217 zone. The bull channel cuts through the 2,130 support level at this time, but the 2,217 battle starts now. The Nasdaq is looking at a support test around 2,600 of its broad channel built off the March 2009 low over the coming weeks. An additional support level can be found at 2,535, although by then the rising channel will be history. Nasdaq Bullish Percents broke below the most recent swing low, currently sitting just above the 50% level. This suggests the corresponding price swing low from March of this year will follow with a break too. The Percentage of Nasdaq Stocks above the 50-day MA has collapsed to 22% - which is bounce territor

Daily Market Commentary: Semiconductor Index at 200-day MA

Image
Today's low volume gains came a day later than expected but it did leave bulls with options. Best of the mix looks to be the semiconductor index. Semis closed with a small doji (bullish harami cross) right above its 200-day MA and along a line of support from the March swing low. Short and intermediate term stochastics are oversold. The Nasdaq 100 closed at a minor support level of the April swing low. As with the semiconductor index, momentum is oversold. However, the 200-day and March reaction low are still some way off. The S&P posted a low volume gain. The coming days may offer a more solid long play if early-buyers can squeeze shorts into a bear trap. The Nasdaq is in a similar position, holding what was gap support from March. The worry for bulls was the lack of volume associated with today's buying. If tomorrow can provide some impetus there may be enough to see a challenge of overhead 20-day MAs. A break, particularly in the semiconductor index, will l

Daily Market Commentary: Bullish Setups?

Image
The fifth day of declines has taken indices to a point where a reaction can be expected sooner rather than later. Today's setups, with indices closing near the two-day lows, offers a relatively low risk entry for longs. The S&P finished closest to its 2-day low with an inverse hammer. If a bounce does occur and it pushes above 1,294 it will also create a bear trap. Both short and intermediate term stochastics are oversold. The Nasdaq closed at it's low and just a few points below the April swing low of 2,706. Like the S&P it exhibits both oversold short and intermediate term stochastics. Place a stop on a loss of 2,700. Nasdaq Breadth indicators are melting away in support; 56% of Nasdaq stocks are on point-n-figure 'buy' signals compared to 60% at the March low. The semiconductor index also offers a long side opportunity with a bullish divergence in the CCI. Stops go on a loss of 415. The Russell 2000 offers a more traditional candlestick set up w

Daily Market Commentary: S&P Death Cross

Image
Economic concerns continued to pressure with financials leading the push down. The S&P finished the day with a 'Death Cross' as April's reaction low was cleanly sliced. March's low with a converging 200-day MA next. Volume climbed to register a distribution day. The Nasdaq also experienced a 'Death Cross', but volume was light and it's a fine line as to whether April's low is breached (or not). Nasdaq Bullish Percents are weaker now than they were in March. Note the spike in the relationship between the Bullish Percents and the Percentage of Stock above the 50-day MA - the last time this happened was the March reaction low. Also note the bullish divergence in the MACD and CCI. This has the look of a bounce setup, even if it's only a relief bounce. The Nasdaq Summation Index also cracked below the March reaction low. But hardest hit of all the indices was the Russell 2000. It took a greater than 1% loss and is well on course to test Ma

Archive

Show more