Posts

Weekly Market Commentary: Bull Traps in Nasdaq and Small Caps

Image
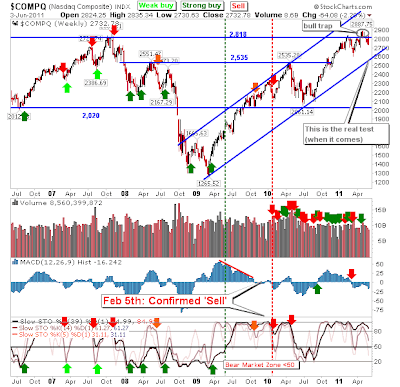
Finally have internet hooked up so its nose to the grindstone again! There were two significant reversals on the weekly time frame from my last update. First up is the bull trap in the Nasdaq; defined by 2,818. The break above, then below this level occurred within a broader bullish channel. It's not a disaster for bulls but it's a clear shot across the bows. The test of rising channel will be a more important battle for bulls. The Nasdaq 100 was not as susceptible to the bull trap as it's sister Nasdaq. The threshold for support is 2,217 which is still a good 65 points away. Losses of the past month are more likely to represent a broadening of the 9-month trading range - but what happens elsewhere will ultimately influence if 2,217 support can hold. The Percentage of Nasdaq Stocks on point-n-figure 'buy' signals dropped below the bullish 60% mark to a more neutral stance. While the Percentage of Nasdaq Stocks above the 50-day MA is down at 34%, but well

Daily Market Commentary: Ugly!

Image
Internet due on Friday - so hopefully back in the swing then. Just a quick note on yesterday's selling. Poor manufacturing and private-sector hiring data thrusted a knife into the heart of the market. This resulted in many market charts showing evidence of possible head-and-shoulder tops. The Russell 2000 had left a 'Bear Trap' following an earlier break of neckline support. But this 'Bear Trap' is now under pressure from a whole new slew of sellers. The low of the 'Trap' is the do-or-die line for buyers of the past few weeks. However, bulls can take some heart. Markets have been effectively range bound for 2011. January/March reaction lows are more important levels of support than the aforementioned head-and-shoulder patterns. The 200-day MA for many indices are also converging on these reaction lows - another positive for bulls. Follow Me on Twitter Dr. Declan Fallon is the Senior Market Technician and Community Director for Zignals.com . I off

Daily Market Commentary: 50-day MAs break

Just a quick post to keep things going. Comprehensive loss of 50-day MAs in S&P, Russell 2000, Nasdaq, Nasdaq 100 and Semiconductor index. Only the Dow escaped. Potential break of the neckline in the Russell 2000. Follow Me on Twitter Dr. Declan Fallon is the Senior Market Technician and Community Director for Zignals.com . I offer a range of stock trading strategies for global markets which can be Previewed for Free with delayed trade signals. You can also view the top-10 best trading strategies for the US, UK, Europe and Rest-of-the-World in the Zignals Trading Strategy Leaderboard . The Leaderboard also supports advanced search capability so you can tailor your strategies to suit your individual requirements. Zignals offers a full suite of FREE financial services including price and fundamental stock alerts , stock charts for Indian, Australian, Frankfurt, Euronext, UK, Ireland and Canadian stocks, tabbed stock quote watchlists, multi-currency portfolio manager , active s

Daily Market Commentary: 50-day MAs Defended

Image
For the few days after I left on vacation it looked like bulls were going to undo the 'bull traps' which popped up across the different indices, but it was not to be. The Russell 2000 was picture perfect in the bearish turn, failing to challenge reinstated resistance at 855, leaving what may be a bearish head-and-shoulder pattern; the 820 level critical in this regard. Tomorrow may yet see this break (it did so intraday today, but closed just above). The clean slice of the 50-day MA is a bad omen for other indices which managed to cling on today. Technicals are all bearish and momentum hasn't reached oversold levels (on an intermediate time frame, although has on the short term). Ugly... ($RUT) via StockCharts.com Torrid action in Small Caps undid what looked to be a solid defense of the 50-day MA and breakout support in the Dow. Volume climbed to register a distribution day, but there may be enough to see a longside play tomorrow. ($INDU) via StockCharts.com The S

Post Light until May 20th

Image
On vacation and when I return it will be a move into a new place (setting up internet can take a while). Always something seems to happen when I'm away so no doubt the market will decide to continue downwards... There is a bull trap in the S&P ($SPX) via StockCharts.com Nasdaq ($COMPQ) via StockCharts.com But the Russell 2000 held its 50-day MA ($RUT) via StockCharts.com As did the semiconductor index ($SOX) via StockCharts.com Can the semiconductors and Small Caps advance their cause? Or will the newly tapped bull traps in the Nasdaq and S&P take indices lower? I prefer the former scenario over the latter in the short term - but bull traps are hard to reverse.

Daily Market Commentary: Small Caps on the Run

Image
Indices managed to recover some of their losses by the close, but the real damage was done to more speculative Small Caps. This is not good news for those looking for a continuation of the long standing (Mar 2009) bull market. With money channeled to less speculative Large Cap stocks, it marks an end phase for the rally. Starting with the S&P, the index was able to hold 1,343 support with the 20-day MA rising to lend additional support. A bounce 'buy'? Today's buying opportunities (SOX and Russell 2000) proved to be a risky - and losing - ride for those who took the option to buy the open. There is every opportunity for the S&P to disappoint. Set a stop below Wednesday's low. ($SPX) via StockCharts.com The Nasdaq made it down to its 20-day MA before it recovered some of the losses. Some may consider the break of 2,836 done and dusted (it finished at 2,828), but there was enough buying in the afternoon to suggest it may follow through (higher) tomorrow. (

Daily Market Commentary: Semiconductors To Rally?

Image
An odd day for the markets. First there was the confirmed 'bull trap' in the Russell 2000. Today's losses brought the index further below reformed resistance, but back to its 20-day MA. While at its 20-day MA it offers a long-side opportunity, but with old resistance at 855 it might be a short lived one. ($RUT) via StockCharts.com The semiconductor index suffered a second significant day of selling to take it back to converged 20-day and 50-day MAs. Ironically, converged 20-day and 50-day MAs are on the verge of a bullish 'Golden Cross'. However, this may offer the leverage for a long-side opportunity. ($SOX) via StockCharts.com Meanwhile the Nasdaq did enough to recover the intraday losses to finish above 2,836 support. Will this help the semiconductor index tomorrow? ($COMPQ) via StockCharts.com The Nasdaq 100 also took losses which saw a break of the 4-day congestion. However, it recovered to finish on breakout support. It still could go either way,

Archive

Show more