Road Works Ahead: Gap test
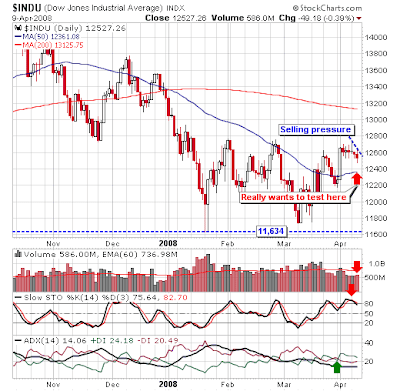
Thanks to TraderMike for the link-love. With Tech and Small caps getting hit with above average selling, there is an indication Large caps will follow suit; the three day sequence of lower highs and lower lows - albeit on tight trading - tends to favor a break to the downside. As noted by TraderMike, the 50-day MAs will be key support across the board. Certainly market breadth indicators are calling for a breather in the near term.

The best example of a (short term) overbought breadth indicator is the S&P Bullish Percent. Look for a push to 1,315-1,335 in the S&P:


The best example of a (short term) overbought breadth indicator is the S&P Bullish Percent. Look for a push to 1,315-1,335 in the S&P:


