Posts

Showing posts matching the search for Semiconductor channel breakout

Nasdaq Accelerate Rally

Image
The Nasdaq is accelerating through channel resistance as relative performance continues its run of good form. Technicals are all good as Friday's action registered as accumulation.

Daily Market Commentary: Nasdaq Breakout

Image
A double confirmation for bulls: a negation of the August 'bull trap' with today's breakout and a failed measured move target lower. Technicals are all bullish, although the ADX is below 20, indicating a trendless environment. However, I suspect today's breakout will change this.

Semiconductors Index Breakout but Dow at Channel Resistance as Small Caps Breakdown

Image
Lots of divergences in play across the markets. Start with the positives, the Semiconductor Index edged above resistance in what looks like breakout. It lost ground Friday which suggests it may still require a redrawing of resistance if this is some form of rising channel. However, in the near term, this looks like a genuine breakout and look for a move to triangle resistance.

Rallies Defended

Image
There wasn't a whole lot to Friday's action, but the one thing which was important was the successful defense of the Russell 2000 channel breakout. As a bonus, the Nasdaq is running alongside channel resistance and is ready to accelerate higher. The S&P is caught in the middle of its channel and Friday's action didn't change anything. The Thursday breakout in the Russell 2000 gave up nearly 0.5%, but didn't reverse any of the earlier bullish technical picture.

From: Fallondpicks.com

Image
Ben Bernanke swung his axe and the markets tumbled. Late afternoon trading was unable to hold early gains; especially in the NASDAQ and S&P . But some markets never got off the ground. The Dow was the big loser in this regard, but the semiconductor index was another index to suffer. The Russell 2000 clung to its leadership role. The bearish divergence in the MACD was breached in the latter index, but a similar divergence in the CCI of this index remained. Of the secondary tech indicators [ $NASI , $NAA50 and $BPCOMPQ ]; the $NAA50 switched back in favor of the bears, weakening the chance of a short term tech bounce. Also of concern was the ticking time bomb that is volatility . The index has likely found stronger support at 15, than it has resistance at 18 - this could see a sharp dose of fear over the coming weeks, which will pile on the misery for those who have bought into the market over the last couple of months. The NASDAQ maintained channel resistance

Short Covering Driving Gains in Semiconductors and Nasdaq 100

Image
The Nasdaq 100 breakout cleared channel resistance, the fifth significant breakout in four months. All technicals are posting new near-term highs which also meant the short generated on the tag of the rising channel is negated.

Markets Rally In My Absence; Dow and S&P Opportunity.

Image
Before my vacation I had noted three indices to watch  undergoing support tests: Semiconductors, Nasdaq and Dow Jones Industrial Average had all presented buying opportunities. However, I had also thought these rallies would stall out when they got back to resistance - this did not prove to be the case.  With the exception of the Semiconductor Index (which did rally), all indices managed to post new highs for the summer. The Semiconductor Index is the one which may present a profit taking opportunity (or a potential shorting chance) as it approaches triangle resistance.  Given both the Nasdaq and Nasdaq 100 are at new multi-year highs and technicals for the Semiconductor Index are net bullish - and this rally begun from a 'bear trap' - chances are this will continue beyond 1,410 and go to challenge 1,440 and likely more.

Stock Market Commentary: Bull Breakout

Image
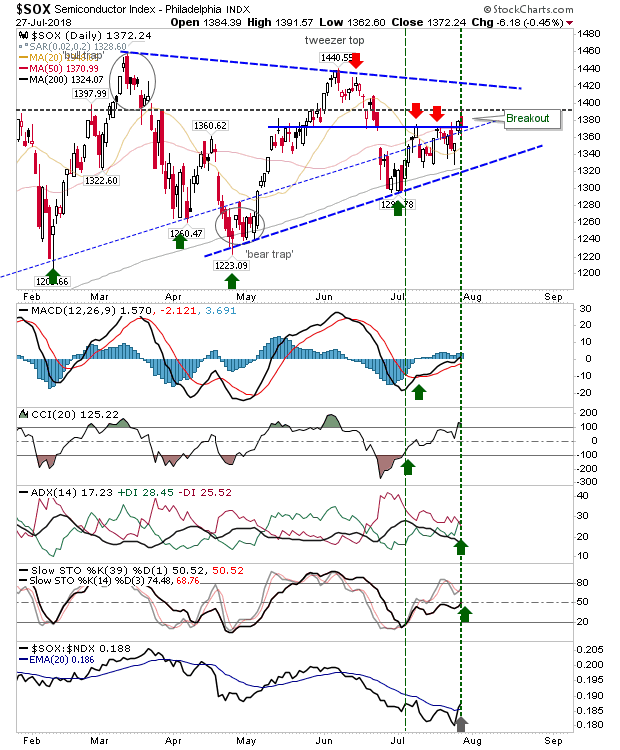
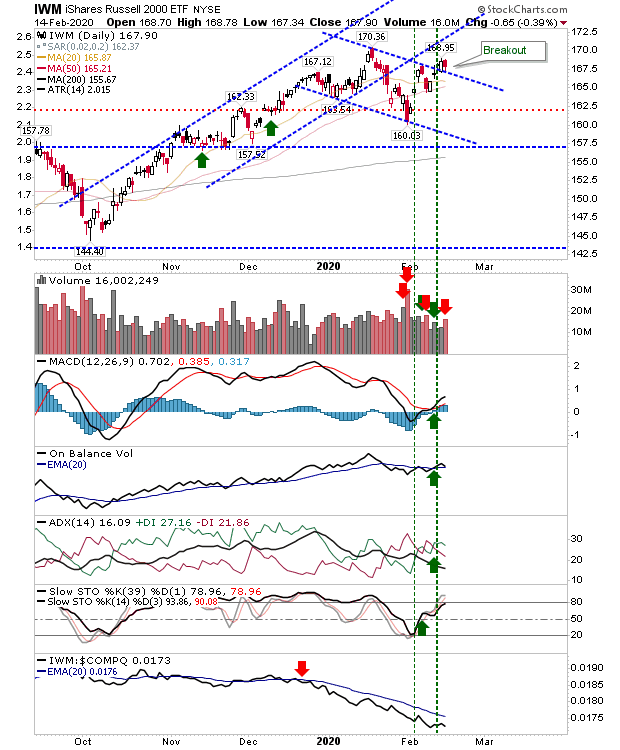
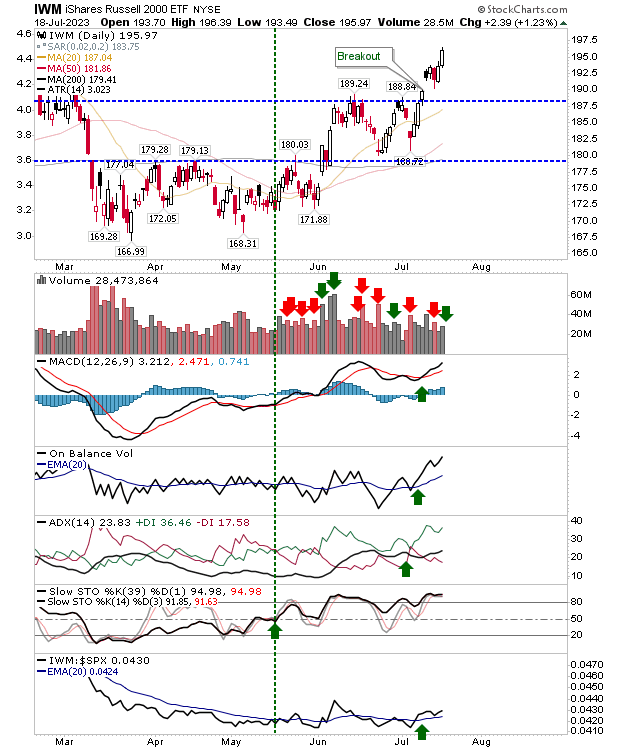
Finally, bulls make their move. The Nasdaq enjoyed a clean channel breakout with a solid move higher - even if volume was a little disappointing. First test will be the 20-day MA overhead. The Russell 2000 also enjoyed a channel breakout, matched with a CCI 'buy' signal. The semiconductor index is up against the 20-day MA which will be a big test for the other indices for the early part of next week. The S&P only managed to push just beyond channel resistance, but a shift in relative strength towards more speculative small caps is a bullish sign. So with the shift we now have the most bullish alignment for markets with small caps leading tech leading large caps. Look for more gains Friday. Dr. Declan Fallon, Senior Market Technician for Zignals.com , offers a range of stock trading strategies for global markets under the user id: ‘Fallond’, ‘ETFTrader’ and ‘Z_Strategy’ available through the latest rich internet application for finance, the Zignals Dashboard ; many are rank

Semiconductor Index Phase II Breakout

Image
There were small gains, but again it was the Semiconductor Index which had the best of the action. It inked a second, modest breakout, but there is still another declining resistance level to go before it starts challenging highs. Watch for a MACD trigger 'buy'.

Channel Resistance Tags for S&P, Nasdaq and Nasdaq 100

Image
Since redrawing channel resistance the S&P, Nasdaq and Nasdaq 100 now find themselves up against (accelerated) channel resistance. This may be viewed as an opportunity to take (partial) profits and/or sell covered calls.  Buying volume for the S&P was modest and technicals remain strong but some pause in the buying would look preferable at this point.

Stockcharts.com: Weekly review

Image
Stockcharts.com is back online. Not all the public listers were able to update for the weekend, but there is still plenty of information to review. Joe Reed hadn't added much more to his indices; although he did give a chart for NYSE - by his reckoning there looks to be a top given the PPO is flat on an RSI > 70. but is monthly chart favors continued strength (presumably after a downward leg over the short term): His healthcare chart shows a breakout - but he looks to be sticking to his top given a false breakout occurred in January. Mitchell Meana highlighted a lovely consolidation triangle in the 60-min Q's; upside target of $45.88 But his daily Qs chart is on a 'sell' signal: It still looks like he favors further upside in small caps as he waits the bottom of wave 4 to the rising channel: But, his Gold Bugs index ( $HUI ) has a 1-2 wave of a larger downward trend: Ted Burge repeated his mantra about DEMAND in control, but markets at RESISTANCE. Dec 16th! Be no

A Bear Market for S&P could only touch 2016 lows

Image
The 'most hated' rally, started in 2009, suffered a potential setback with wide range (neutral) candlesticks across markets. How much the UK election result played on this remains to be seen but Friday's trading marked a day of chaos.  Shorts should not be jumping so much for joy. The rally for the past few months has taken indices to a point where a 25% loss - a definition for a bear market - would only see tests of February's lows in 2016 (and nowhere near a test of 2009 lows or anything later). The S&P experienced higher volume distribution as the day closed with a 'spinning top'. Next week will be about consolidating the action in the context of Friday's close and holding the breakout. Technicals remain positive

Daily Market Commentary: Market Pause

Image
Other than a slight uptick in volume for the S&P, it was a relatively quiet day. The one index which hinted at a change was the semiconductor index.  It had been trading in a sideways range which had drifted outside of its narrow, rising channel, but yesterday's close positioned it as a break of support. The 50-day MA is nearby to provide support, but with technical weakness expanding there is a strong possibility for a larger move down.

Strong Finish To Week

Image
Markets feeling the pressure of Thursday''s selling recovered to maintain recent breakouts. For example, the Nasdaq 100 made it back to breakout support after briefly undercutting this level on Thursday. Technicals are all bullish and the index remains well placed for further gains.

Fallondpicks.com commentary

Image
Hardly a surprise to see the markets get hit after weeks of mini-gains. The degree of losses were a little startling but given this was the first day after the holiday it is a little early to say if today's actions sets the tone for the rest of the year. The NASDAQ was hit with a 'sell' trigger in the MACD; confirming a new bearish divergence in this indicator, but is still able to hold the June-July bullish divergence (at least for now). In addition, the 2.2% loss on the day failed to break the bullish rising channel or the 20-day MA. There is a good chance of seeing support buying over the next few days. The NASDAQ 100 was a little stronger in that there was no MACD 'sell' trigger and at least for now no bearish divergence in this indicator. The semiconductor index fared the best (but was by far the weakest of the tech indices) as it maintained its break of the 200-day MA while holding reasonable technical strength. The Dow and S&P were less fortunate as

S&P Firms Breakout As Tech Keep The Pressure On

Image
Given overnight news and Netflix disappointment I was surprised to see markets finish as strong as they did given comments on the economy by the Fed Chairman. The S&P opened at support and 'engulfed' the prior day's trading; it's not a true bullish engulfing pattern as this is a reversal pattern and what we have is a breakout but it does contribute to a confirmation of the breakout.

Rallies move into fresh air as Friday's bearishness is negated

Image
A bright start to the week has given bulls an important advantage, although trading volume remained light overall. Since the breakouts in early July I would be looking for a more substantial retest of breakout support than what we saw last week.  However, there is no guarantee we will see such a move. In the case of the Russell 2000 ($IWM), today's gain pushed beyond the tight trading of the last four days. Volume rised to register as accumulation, but in overall terms, today's volume was light.  Technicals are net bullish. I would like to see tight trading near the highs of today to consolidated the jump. 

Daily Market Commentary: Mixed Bag

Image
Another mixed for the markets; one offers promise going forward - others sit at important junctions. The S&P spent a second day at channel resistance. The small 'hanging man' reflects uncertainty, but the lack of volume suggests there was no concerted selling - simply a lack of buyers willing to drive a break. Technicals, while weak, continue to support the long side. ($SPX) via StockCharts.com Friday saw a low volume breakout but with a gravestone doji. This was followed by a bearish engulfing pattern. The Nasdaq breakout is still intact - although under pressure and more likely to see losses tomorrow. Should this prove true, a bull trap will result. ($COMPQ) via StockCharts.com The Nasdaq 100 also closed with a bearish engulfing pattern at its 50-day MA. The past two day reversal has the makings of a reaction top and the start of a downward channel. The key aspect in the Nasdaq 100's defense is its strength on the weekly timeframe . ($NDX) via StockCharts.

Russell 2000 Tags Resistance As S&P Breaks (Again!)

Image
I forgot to mention last week that the S&P has reached the "15% of Profit Take" zone of historical price action relative to the 200-day MA dating back to 1950. If it reaches 1,653 it will be in the 5% percentile of historic action - a 'strong sell' signal.  The price tag came with a fresh breakout from the channel; the second breakout in 2018.

Friday Accumulation

Image
Indices finished the week strongly, pushing a follow through to Thursday's gain. Volume climbed to register an accumulation day. Indices still have to contend with moving averages as resistance, but get above these and there is room to run to all-time highs from last year. The S&P is back at converged 20-day and 50-day MAs which is also the neckline of the head-and-shoulder pattern. If bears are to retain control then the neckline has to hold as resistance, which means there is little room for additional gains. Relative performance has switched to under performance against Small Caps.

Archive

Show more