Posts

Showing posts with the label Stockcharts review

Stockcharts.com Weekly Review

Image
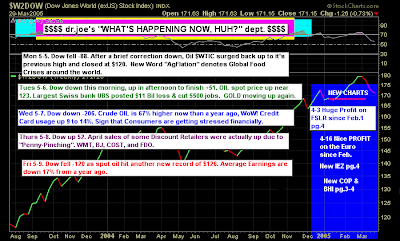
May as well try and get a review post up before Monday's open. Feeling very sleepy... 2 hrs sleep on a red-eye is not good for the soul. Dr. Joe raises the issue of "Agflation". Interesting thought - but I think commodities have peaked for this stage of the bull cycle, although the best may yet be to come. Joe is looking at a potential breakout for oil companies - but commodity-based stocks tend to lead commodity prices, so if they fail to break it would be bad news for oil: Not marked, but there is a 'sell' trigger in the Dow's PPO: Maurice Walker has jumped up the league table - his weekly review is worth the price of entry. Maurice looking for a breather in the markets, his closing paragraph pretty much echoes what I think will play out. Follow his link to get his charts: There was contest held a while back called the wacky warning label contest. Second prize in the competition went to a certain warning that was written on a kitchen knife that said 'n

Stockcharts.com weekly review

Image
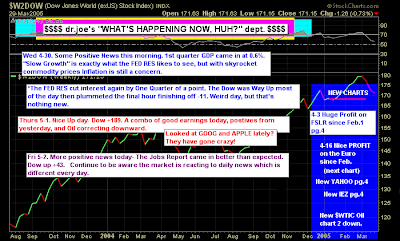
Running a little late on everything this weekend. The MSFT-YHOO fun and games may have some dampening influence on proceedings for Monday, but how went the week? Dr. Joe is watching daily machinations: Although the dollar is attempting a run of strength (which will hurt gold prices); oil looks to have found a point of strength: He has called a breakout in the Dow: Ted Burge is watching the Q's. A positive test of support? The point-n-figure chart is looking for $53.59 off the May 1st Ascending Triple Top Breakout: Maurice Walker has called an end to the correction. His fan chart shows it nicely: Maurice's commentary is a(nother) good one, although I disagree with him on the market not closing in bear market territory; in January of this year breadth indicators reached levels comparable to Sept 11th and the Asian Currency Crisis. We may have got strong bull markets from them, but the action which led to these lows was certainly bearish. However,

Stockcharts.com weekly review

Image
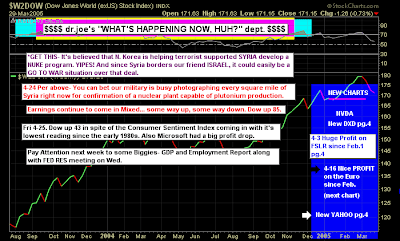
A week which has mostly passed me by with respect to the market. So what did happen? Dr. Joe is looking to nest week's figures: Dollar looks ready to make some headway north, possibly to 77-78 level: He has given the new Stockchart's charting features a go: But there looks to be a breakout in the Dow (Joe doubts it another chart - but it looks good to me). PPO looking strong: Maurice Walker is now second ranked Stockchart public list; his weekly review makes it one of the best. I like his analogy for this week: I've been following the a recent news story about John Darwin, who was a canoeist that faked his own death. He and his wife committed insurance fraud as he went into hiding in Panama. Darwin claims he had amnesia for the past five years. If he is found guilty he could face up to 10-years in prison. Darwin had been written off as dead by everyone, only to come to find that he wasn't dead after all, he was only on a short hiatus. John Darwin was alive, and so is

Stockcharts.com weekly review

Image
A big push on Friday looks to have given bulls an edge. How did the Stockcharter's see it? Dr. Joe kept an eye on Oil as it continued its march ever higher. What do stochastics say here for the Dow? Will the next backtest reset support/resistance for this indicator? Considers the Nasdaq and S&P as contained by resistance: The Maurice Walker homily favors further gains: The daily DJIA got a break above its double bottom confirmation line of 12,767 on Friday. The pattern measures 1133 points having a target of 13,900. I expect the other daily index charts such as the S&P 500, the Nasdaq, and Russell 2K to follow the Dow's lead, and eventually move above their confirmation lines. Once the double bottom patterns breakout, prices will challenge the intermediate downtrends. However, the Russell 2K must break above its intermediate downtrend before it can break above the double bottom pattern. The S&P 500 rose 4.31 %, the DJIA increased 4.25 %, and the Nasdaq climbed 4.

Stockcharts Weekly Review

Image
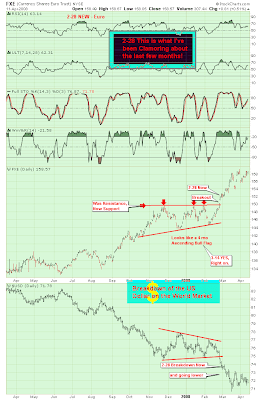
A bit late on this, but before Monday's open here is the weekly Stockcharts.com review. Dr. Joe has his Currency Shares Euro Trust (FXE) prominent. What is interesting from this chart is the consolidation in play for the Dollar / Euro Trust. Should the dollar break down it will provide a boost for Gold, hurt the market and be business as ususal. However, should the dollar counter break higher it would set the cat amongst the bear pigeons. If this was to happen look for a sharp one-day gain, and look for this to happen real soon: Joe's Dow Stochastics shows a well marked top with plenty of room before a bottom is reached: Once again - keep an eye on Health Care. It looks like May will be the month it finds it bottom: Ted Burge is watching the financials; support at $24.15 Although the point-n-figure chart has a target of $23.63 The Russell 2000 is at an interesting juncture; can 689 hold? If not, its 642 on the menu The Point-n-Figure chart clings to 760 as a target.... Mauri

Archive

Show more