Posts

Showing posts with the label Sector

F-day

Image
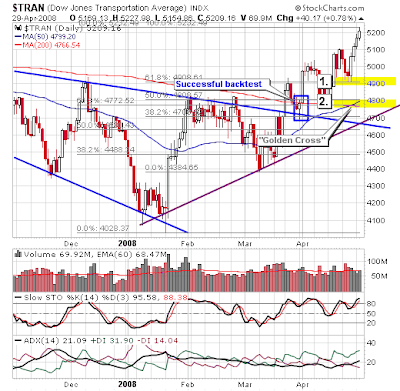
How will the market react to whatever the Fed decides to do? Because of the tight trading for the past few days the expectation will be for a sizable move one way or the other. The 200-day MAs are a logical upside target, with the 20-day and 50-day MAs lurking below. Markets have effectively traded sideways since the January bottom and it would be good for this pattern to be put to rest. The best action for the bulls comes from the Transport index (even with all the woes in the airlines). The ADX confirms a bull trend and the "Golden Cross" between the 200-day and 50-day MAs shows a long-term bullish shift. Given this, I suspect we will see higher prices over the coming weeks even if the Fed 'disappoints'. Points [1] and [2] on the chart mark likely retracement points (based on Fibonacci and support) for a negative reaction to the Fed. Get the Fallond Newsletter

Keep an eye on those Transports

Image
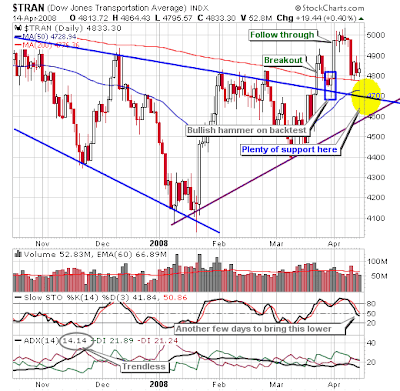
The Transport sector (and therefore the outlook for the economy as a whole) didn't have it easy over the past few days. UPS disappointment was enough to break the low volatility slumber markets had enjoyed for the best part of a week. However, the Dow Jones Transportation Average continues to hold firm at its 200-day MA with the 50-day MA on course to trigger a "Golden Cross" - a significant long term bullish signal. How this gets reflected in the Dow is more difficult to predict. The UPS related sell off brought the index back inside its triangle consolidation. There is still plenty of room for a move back to consolidation support which should be viewed as bullish - no doubt bears will see this as a confirmation of their position, but they will be wrong unless March lows break. So bulls could endure another 450 point loss in the Dow and still maintain the upper hand, especially if Transports can keep above rising trendline support connecting Jan-March lows (c4600, or

Semiconductor Holders (SMH)

Image
The 50-day MAs are the talk of the town for the various indices. The SOX is stuck below its, but the Semiconductor HOLDRs ( SMH ) broke through - a nice follow through to Tuesday's higher volume resistance breakout. If this breakout holds it will be good news for the Nasdaq and Nasdaq 100 . In defence of the SOX , it is on the verge of a major breakout of both its 50-day MA and declining resistance from December. If it takes its lead from the SMH and breaks though it will create some room for a nice run to the 200-day MA. It's not hard to find wags waiting for the next decline, knocking recent market strength. I would prefer to see a more active retest of January lows, but the more I look at this market - the less I think this will happen. Trade my Stock Picks at

Bulls step in....

Image
The McClellan Oscillators held their bullish form as bulls stepped in, with volume, to stall 3-days of declines. At least on a closing basis (ignoring the intraday range) both the Nasdaq and NYSE are on course for a double bottom; confirmation will come on a closing break of 2,400 for the Nasdaq and 9,250 for the NYSE. Dow Theorists will take comfort in the strength of the Dow Transports. Note how bulls maintained control as other markets reversed from their late January bounce [+DI > -DI; ADX > 20]. Stochastics are overbought which suggests a pullback to test the 50-day MA is needed to shake out the last of the weak hands. Volume in this index has certainly sided with the bulls. Volatility watchers are unlikely to see another spike into the high 30's on this decline, and those waiting for a second spike before buying are likely to be disappointed. A push back to the 200-day MA would look to be the most likely scenario. Nasdaq theorists will look for the semiconductors to

Buyers range established

Image
The last two days have seen tweezer bottoms in large cap indices, a bullish piercing pattern in the Nasdaq 100 , and a (somewhat) bullish engulfing pattern in the Nasdaq . But my favorite, the semicondutor index , refused to buckle in the face of broad market selling over the last week - although it would be hard pushed to shed more than it has already. Wednesday's bullish hammer is the icing on the cake. Watch for a fresh MACD trigger 'buy' (but well below the bullish zero line, a weak signal) as other technicals improve: The Semiconductor index has a Point-n-Figure chart target of 260 (which would amount to a 50%+ decline from its 2007 highs!). To negate this target the index would need to muster an upside breakout, with 364 likely to define such a threshold. The technology sector is one of the first to push higher from a recessionary environment. Chips should lead other technology based sectors. For the purpose of disclosure I am long some deep-in-the-money calls on the

Time for the semis?

Image
If you are not wanting to invest into an individual stock, and are looking for something of value which hasn't the taint of financials, then the semiconductors could be the sector for you. Technology stocks have played a background role in the cyclical bull market, losing interest to the more energetic, commodity-based stocks. Technology is one of the early leaders out of recession and the semiconductors are a key component of any recovery. The sector has taken a beating since July, losing over 20% of its value - a true bear market and a worrying measure of the state of the economy. However, a number of factors have come into play which give the sector a distinctly bullish (technical) feel: [1] The recent break of declining resistance [2] New near term highs [3] A clean break of the 20-day MA [4] A bullish divergence in the CCI [5] Rising MACD following earlier 'buy' signal (although deep below the bullish zero line - so watch for a retest of 401 lows). Dollar cost averagin

Archive

Show more