Posts

Nasdaq consolidates its latest breakout

Image
The bait-and-switch of the Russell 2000 gain followed by the move in the Nasdaq has left the latter index in the best position to push on.  While Friday's gain in the Russell 2000 was welcome, the trading range muddied the issue.  The Nasdaq has none of this overhead and the breakout has room for further upside given its working at all-time highs. Technicals are net positive; it even managed to regain its relative performance advantage against the Russell 2000

Finally, some conviction in the markets

Image
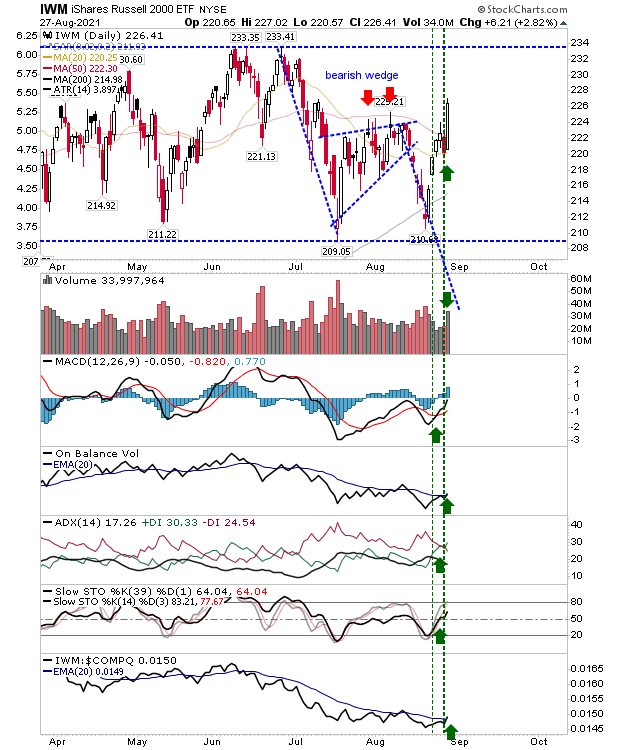
It has taken a few weeks for something desicive to happen in the market, but it looks like Friday delivered on some low key bullish promise with a firm accumulation day.   Best of the action was reserved for the Russell 2000 ($IWM) as it pushed through its 50-day MA with a solid white candlestick.  Technicals are net bullish with a key relative performance up tick against the Nasdaq and S&P. Small Caps look to be in the ascendancy, so now it's question whether the index can go on to break from its trading range.

S&P and Nasdaq at new highs

Image
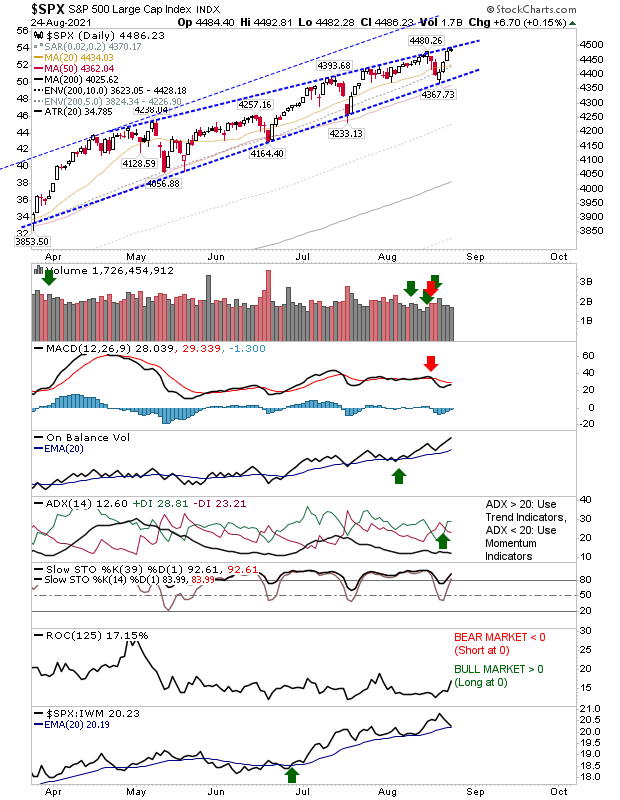
Finally, we got to see some movement in the S&P and Nasdaq as both indices finished with new closing highs. For the S&P there is still the potential issue of the bearish wedge as the index closes at its resistance. Technicals are mixed, although it's holding on to its relative performance advantage. 

Friday's recovery opens the potential for a swing low in markets

Image
Friday delivered a second gain for markets, enough to open the possibility for new swing lows to develop - although the falls were relatively shallow.  The Nasdaq had undercut its 50-day MA on Thursday's gap down before recovering. There is still some work to do before it can challenge its prior highs, but there was also a drop in volume on Friday's gains, which suggests there could be further struggles if gains continue.

Losses continue as Dow Jones finishes with potential 'bull trap'

Image
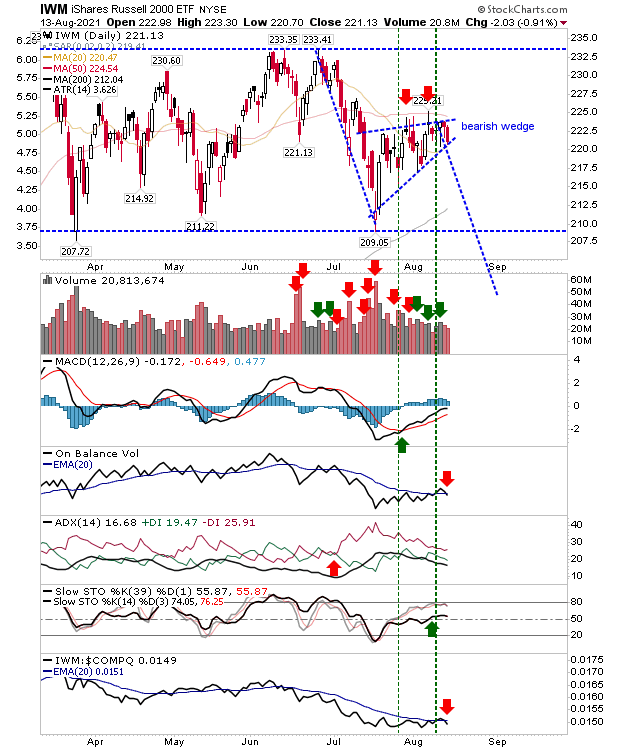
Today's news was not the continued losses from the bearish wedge in the Russell 2000 as such losses have remained contained by the trading range.  Before moving on, the Russell 2000 does have the 200-day MA to look for as a possible positive test despite the net bearish technical picture. 

Stronger bullish action for the Nasdaq and S&P as Russell 2000 suffers again

Image
Sellers tried to put the squeeze on the indices with a large intraday swing lower, but by the close of business those loses were recovered for some of the indices. The Nasdaq had undercut its 20-day MA with a quick loss, but it recovered to finish with a 'bullish' hammer.  However, as the index is not oversold in momentum it's not a strong bullish candletick. Technicals are mixed with a 'sell' trigger in the MACD and ADX, but bullish On-Balance-Volume and Stochastics.  Selling volume was lighter, so there is no distribution. 

Russell 2000 takes biggest loss but trading range unchallenged

Image
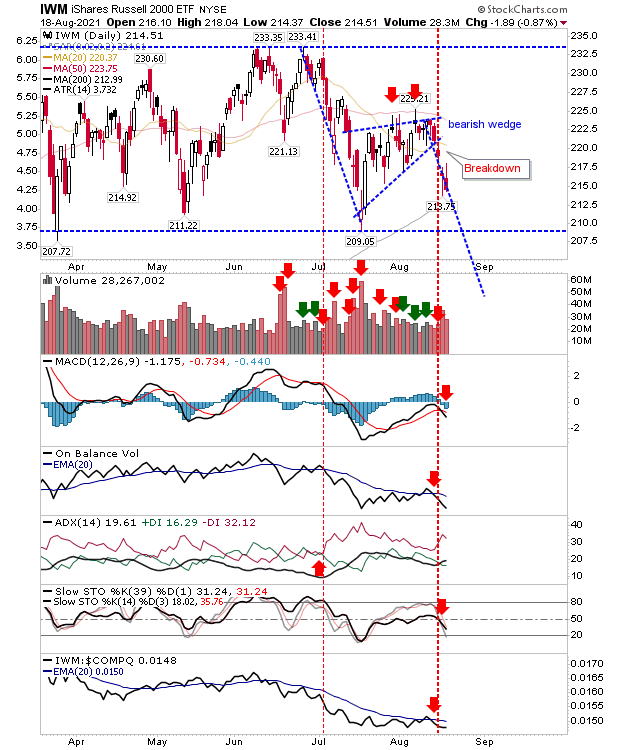
Only one index suffered a loss of potential consequence, but given the Russell 2000 is range bound the near 1% loss didn't do a whole lot of damage.  The 50-day MA remains as uncharacteristic resistance in a range bound scenario, but it makes tracking supply relatively easy as long as it stays as resistance. I have drawn in a bearish wedge, with a measured move target down to monitor. 

Archive

Show more