Posts

Sector Analysis: Utilities Out in Front

Image
Not surprisingly, there has been a dramatic fall in the level of bullishness within sectors over the past 10 days. However, one sector which has managed to keep its nose in front is Utilities ($XLU). Select the 'Utilities' option in the bubble chart below (don't work in Firefox - talk to Google/Firefox as to why!), and watch how it moves from a middling, slightly under-performing, sector to sector leader.

Daily Market Commentary: Bulls Try Again

Image
Tuesday's halt of the decline didn't stick, but Thursday's buying looks to have more metal behind it. For starters, the Russell 2000 rallied enough to create a 'bear trap'. The index now has a 'bear trap' and a 'bull trap' to contend with. But bulls have a handy edge, with the 50-day MA to become Friday's battle, and the 20-day MA next weeks'. Stops go on a break of 1,119.

Daily Market Commentary: A Bearish Twist

Image
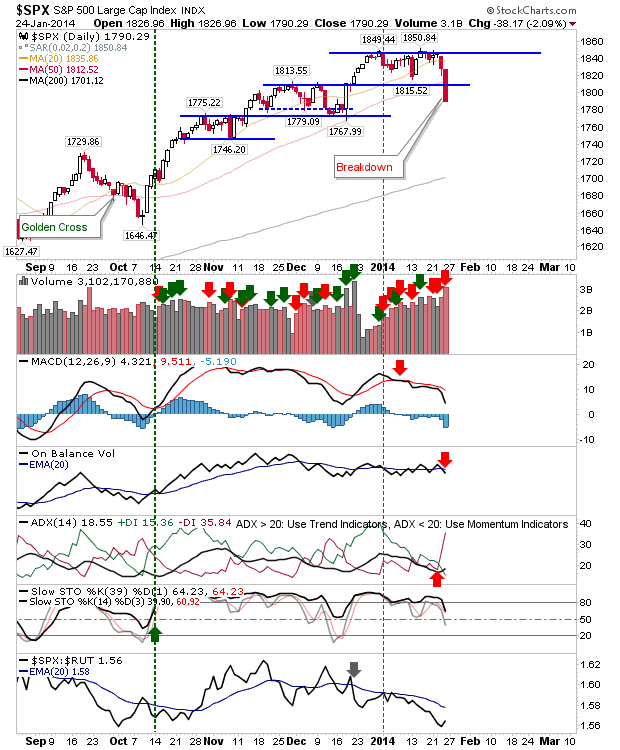
It proved to be a tough day for bulls. Shorts are unlikely to have been the cause of today's losses, although some may not have wasted time jumping on board. Apple's poor results were probably a cue for some long-term holders to bail out, although Fed action and international currency woes were also put forward as excuses, but collectively, this caused the nascent rally to breakdown.  Volume climbed in confirmed distribution, setting up tomorrow for more of the same. Technical weakness in the S&P intensified, although bulls will look to a third day of held support despite the 1% loss on the day. Aggressive longs could look to buy this support on Thursday with a relatively tight stop available. Again, if there is any downside follow through on today, you probably wouldn't want to hold long into the morning session if no fightback was observed. However, a gap down at the open would be an interesting long opportunity.

Daily Market Commentary: Low Risk Bounce

Image
Bulls should have some wiggle room here. Shorts won't like the risk:reward until a rally takes the indices back to 20-day MAs. Until then, bulls can probably be fairly aggressive for the next couple of days. Today was a good start, and yesterday's lows offer the stop placement (with today's lows perhaps the raised stop going forward). Technicals for the S&P are bearish, but with the 50-day MA some 20 points away it's more likely the rally will continue for a little longer.

Daily Market Commentary: Russell 2000 Finished on Channel Support

Image
It was another round of losses in what proved to be a not-so-quiet Monday.  Even with the losses, the index best set for a recovery is the Russell 2000.  Today's losses took it all the way down to, and below, its rising channel; but a late day recovery brought the index back to this support level.

Daily Market Commentary: Breakdowns

Image
Friday saw big losses across the board. It has been a long time since bears have had much influence as they had on Friday. Breakdowns abound, and areas of overhead supply were created where before there was none. The S&P sliced through the low end of its range and through its 50-day MA on higher volume distribution.  Not surprisingly, technicals weakened, but are still net bullish.  The 200-day MA is the long term target, with rallies likely to struggle once the 20-day MA is reached.

Daily Market Commentary: Large Caps Sell Off

Image
It was billed as a slump , but markets experienced losses well within their bullish boundaries. The Dow Jones Industrial Index experienced the largest loss, but it stopped at its 50-day MA, and above horizontal support. With the exception of stochastics, all technicals are bearish. However, bulls maintain their advantage unless support is lost.

Archive

Show more