Posts

Showing posts with the label Market

Tech is where the fun is.

Image
I had noted back in early December how the semiconductor index was due a bounce following some heavy overselling. It responded by falling even further to January lows, but was able to stabilize and rally back to its 200-day MA. During the run to the 200-day MA it has barely paused for breath, and bullish trend strength has been steadily increasing [+DI > -DI; ADX at 30 and rising]. This boundless energy has translated into a positive 2 months for tech averages: Money flow is very positive and the break of the 200-day MA should be enough to extend the rally a little further, as it has done in the Nasdaq 100: But Bill over at VixandMore makes a good case for at least taking some profits off the table . Get the Fallond Newsletter Declan Fallon is developing trading strategies, market indicators and sentiment tools for Zignals

Dow top?

Image
The Dow bullish percents look to indicate a top in the short term. I am watching Fibonacci retracements, which based on prior 'sell' triggers and Fibonacci interceptions suggest downside targets of 12,583 or 12,296. Markets off to a relatively quiet start. Opinion Polls  &  Market Research Get the Fallond Newsletter Declan Fallon is contributing to the development of stock alerts, stock charts, and trading strategies for Zignals

Where next?

At the start of February after breadth indicators reached all-time lows I gave a guesstimate as to what the S&P would do over the coming months. Other than the larger than expected dip in March it has remained relatively ontrack: But where does the market go next? S&P Breadth indicators are getting a little toasty which favors some modicum of weakness over the coming weeks. This would shake out the weak hands and leave the index better prepared for an upside break of the 200-day MA. The alternative is a straight break and run - with barely a pause at the 200-day MA. Get the Fallond Newsletter

What holds for Copper prices?

Image
What goes for copper, goes for technology stocks (and the market as a whole). After what looked to be a triple top for the commodity in 2007, the ever weakening dollar helped push an upside breakout of $375. Broadening wedges are hard to spot and if this is what's at play then a move back to $250 would appear the best case for the metal. However, as long as $375 holds then a run-of-the-mill breakout is to hand, with a projected target closer to $500 than $250. Election years are traditionally viewed as bullish for the market. However, the previous two have been anything but. The protracted Democratic nomination doesn't help given it's only the warm-up to the main event. Wall Street hates uncertainty and it's by no mean clear cut who has the edge coming into November (irrepsective of who wins the Democractic nomination). Political uncertainty and a strengthening dollar, both painted on the background of a weak global environment, suggests copper prices are likely to fall

Bullish Percents getting a little toasty

Image
Although not of immediate concern, some of the bullish percents are about to enter bear market (but not bull market) top territory. If January lows represent the start of a bear market then these breadth indicators should top soon. If the current rally is a continuation of the cyclical bull market then there is room for another 15-20% of gain (perhaps as much as 50% for the Nasdaq Bullish Percents). How this impacts on the market remains to be seen, but the likely outcome would be a negative divergence between breadth indicators and the market; indices make new highs as bullish percents fall. Time will tell. I'm traveling to D.C. so there will be no update tomorrow. INS appointment Friday. Get the Fallond Newsletter

Zignals blog post

Image
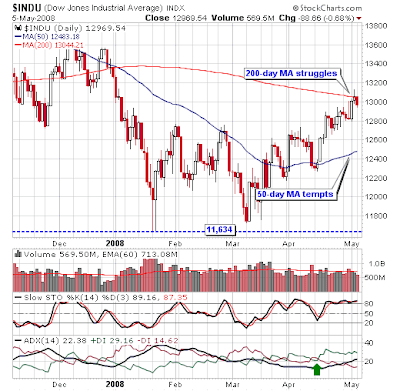
Running tight for time, but I do have a strategy test post for on-balance-volume up on the Zignals blog . As for the markets, the Dow has perhaps the most interest given the struggles at its 200-day MA. Can it follow the lead of the Nasdaq 100? Although it may have its own problems given the 'Hanging Man' just after its 200-day MA break. Both indices show healthy bull trends as measured by ADX. Get the Fallond Newsletter

Dow and Nasdaq 100 are indices to watch

Image
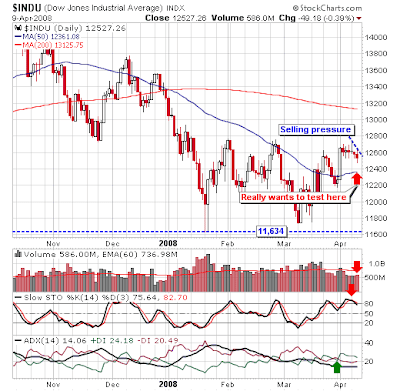
The Fed reversal started late in the day, although futures suggest a higher open. The Dow flashed a (bearish) gravestone doji on higher volume, with the 200-day MA lurking overhead to act as resistance. A push back to the 50-day MA looks the most favored response to relieve overbought conditions, but any close higher today would make a strong case for a 200-day MA breakout. Why? The current set-up looks picture perfect from a bear's perspective, so if it didn't play to expectation you would have to be worried (from the bear side). The Nasdaq 100 has inched its way to the 200-day MA. The gap created at 1,850 looks a logical downside target, but it wouldn't take much buying to push it above its 200-day MA. Get the Fallond Newsletter

Keep an eye on those Transports

Image
The Transport sector (and therefore the outlook for the economy as a whole) didn't have it easy over the past few days. UPS disappointment was enough to break the low volatility slumber markets had enjoyed for the best part of a week. However, the Dow Jones Transportation Average continues to hold firm at its 200-day MA with the 50-day MA on course to trigger a "Golden Cross" - a significant long term bullish signal. How this gets reflected in the Dow is more difficult to predict. The UPS related sell off brought the index back inside its triangle consolidation. There is still plenty of room for a move back to consolidation support which should be viewed as bullish - no doubt bears will see this as a confirmation of their position, but they will be wrong unless March lows break. So bulls could endure another 450 point loss in the Dow and still maintain the upper hand, especially if Transports can keep above rising trendline support connecting Jan-March lows (c4600, or

Road Works Ahead: Gap test

Image
Thanks to TraderMike for the link-love. With Tech and Small caps getting hit with above average selling, there is an indication Large caps will follow suit; the three day sequence of lower highs and lower lows - albeit on tight trading - tends to favor a break to the downside. As noted by TraderMike , the 50-day MAs will be key support across the board. Certainly market breadth indicators are calling for a breather in the near term. The best example of a (short term) overbought breadth indicator is the S&P Bullish Percent. Look for a push to 1,315-1,335 in the S&P:

Nasdaq 200-day MA vs 50-day MAs

Image
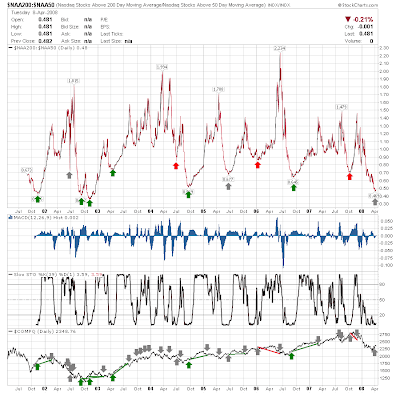
The relationship between the number of stocks trading above the 200-day and 50-day MAs describes the internal health of an index. It is not an ideal indicator, with obvious spikes not necessarily correlating to inflections in the market. This is especially true for spike highs where the number of stocks trading above the 200-day MA is greater the number above the 50-day MA - a situation associated with an overbought market. It is not uncommon to see such spikes occur during a well established decline (and in the case of 2002 spike highs, near the end of the decline). The ratio smooths into a more rounded bottom when the number of stocks above the 50-day MA is greater than the number above the 200-day MA. This situation is a little more helpful in pin-pointing bottoms, especially when the ratio shows twice as many stocks above the 50-day MA than 200-day MA (i.e. a ratio of 0.50 or less). Currently there are just over twice as many Nasdaq stocks above their 50-day MA than 200-day MA (0.4

Market Breakout

Image
Kevin over at Kevin's Market Blog said it best on his Dow Theory watch; Dow followed Transports higher. While the Semiconductors did their bit to support the Nasdaq 100 with a breakout of their own: But there is the question as to what volatility (and fear) will do now there is a test of the 200-day MA? Will profit takers emerge? Or will the 200-day MA turn from support into resistance, thus supporting a more substantial rally than previous corrections in this indicator have given?

Transports manage successful back test

Image
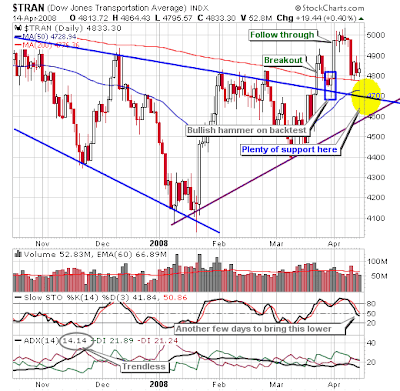
Monday's quiet trading did turn up one key positive; the back test of former resistance-turned support of the Dow Jones Transportation Average ( $TRAN ). The move was accompanied with a bullish hammer on higher volume, giving two more ticks in the bull column. Stochastics are on a 'sell' from overbought levels, so it could take a test of the 50-day MA to work a more solid bounce and reset stochastics. This strength should reflect itself in the Dow index with a break of January-April resistance. Positive money flow suggests accumulation: Can the semiconductor index be a proxy for the Tech averages? The semiconductor index is loitering around its 50-day MA having traded sideways since January. The relative difference between the 50-day and 200-day MAs has narrowed from its max 20% deficit suggesting the worst is behind this index. But unlike the Nasdaq 100, it has failed to break past its 50-day MA. Technicals are neutral-to-bearish so there is little indication that it cou

Bargain basement US stock prices for Euro earners

Is there value for foreign investment in US markets? Given I now enjoy the benefits of earning in Euros I can look at my next trip to the U.S. (and corresponding shopping!) with the eagerness of someone getting $1.58 for each Euro I convert. Or this can be put another way, I can get 58% more U.S. company stock than someone paying for that same stock in hard earned dollars. So to buy Apple (AAPL) in Euros would cost me 88.76 euros (a veritable bargain), or I could get Google Inc (GOOG) at 281.06 euros, and maybe an Apple 32GB iTouch at a cool 300 euros. This relationship is perhaps best represented by pricing the S&P in Euros. In Euros, stocks are trading at levels last seen of late 1998, and very close to the lows of 2003. It may take a year for a discernable market rally and/or rising dollar/weakening euro to emerge (both of which would be considered bullish for U.S. equities), but for outsiders looking in there is real value in U.S. equities. Don't let the bears blinker you o

Yen and the S&P

The relationship between the Yen and the S&P and the relevance of the "Yen Carry trade" has been described expertly by the ETF expert From a technical perspective, spikes in the relationship between the Yen and S&P mark bullish reversals for the S&P. But the degree of the spike may indicate the strength of this bottom. The current spike is of comparable measure to spikes of late 1998 and 2001, but didn't reach the extremes of late 2002 and early 2003. If markets are in the early stages of a cyclical bear market within a secular bear market, then the possible outcome for the current bottom would favor the 2001 scenario over the 1998 one. If this was the case the next rally could take the market back to 1,450 (prior price congestion) before turning down towards the next support level at 1,150. This whole process could take 12-months to evolve. But in the short and intermediate term (next 3 months), bulls should have control.

Transports break past 200-day MA and broadening wedge resistance

Image
The core indices scrambled above their 50-day MAs (or came close to doing so), but one leader of economic activity, the transports, actually cleared its 200-day MA and broadening wedge resistance. A new bullish trend has yet to establish given the ADX knocks aroud 15, but if the 200-day MA can hold it won't be long before a new bull rally is confirmed. The point-n-figure chart shows a triggered Bullish Catapult Breakout from Monday with a target of 5,250. But the real challenge will come on a push to 5,400 resistance. So will the Dow clear its (developing) bullish ascending triangle, or is another trip to support needed? Going by the Transports a straight breakout would be favored. Going by pattern development - another trip to support (and a better opportunity to buy) would make for a stronger pattern. Should the straight breakout occur it should happen within the next few days.

Bullish Percents sing from the same hymn sheet

Image
Yesterday's losses weren't enough to prevent a bullish cross of the 5-day EMA for the Nasdaq Bullish Percents. This follows earlier crosses for the S&P and Dow bullish percents. What is clear from these charts are the bullish divergences between January and current lows for the bullish percents with respect to the parent indices. Basically, more stocks are on point-n-figure buy signals now than back in January, even with the indices making new lower closing lows. What is important going forward will be the need to break declining (closing) resistance initiated in January for the Dow, S&P and Nasdaq. The Nasdaq looks best placed to challenge, although the Dow is closest to the major moving averages (20-day and 50-day MAs). Thursday probably won't reveal too much going into the long weekend, but next week should be interesting.

Volatility and the 2000 top

Image
I took a look at the 2000 top for the S&P and compared how volatility from then compared to now. During the 2000 peak there were four small sub-30 micropeaks, a sharp drop, then a rally to 35 which was associated with the cliff fall for the early part of the 2001 decline in the S&P. Monday's peak above the recent triple top may precede such a decline, although breadth indicators do suggest otherwise (i.e. this will shape into a double bottom). However, it has been a while since the VIX has seen a spike to 45. It would be hard to argue against another one happening soon, which would mean more pain for the markets. The Fed may bring some short term welcome relief, but when the guts of next rally are done we could have the kind of setup where a VIX spike to 45 would be favored. Perhaps September/October of this year??? Who knows, but the beast is out there - lurking, waiting to strike.

What you should be reading for today

Looks like St. Paddy's day was not one for Bear Stearns (or its employees) to celebrate. The subsequent action in the markets reflected the panic. Bill has an excellent chart showing the relationship between the VIX and 10-year Treasury Yield . This ratio is at levels last seen in the 2002/2003 bottom TraderMike has his usual succinct summary. He is watching 2,200 closely in the Nasdaq. Market reaction to Fed decision will decide whether we have support or resistance. Will the Fed cut by a full 1% ? Will Markets view it as the needed cure? Or a panic reaction to the current state of affairs? It sounds like a lot to me - but what do I know. Barry has Lehmans on B.S. watch. Steven Smith at TheStreet.com noted heavy option trading volume in B.S. over the course of the last couple of weeks. Kevin's Market Blog is looking for a measured move target down to $39-39 for the Qs . Quantifiable Edges notes how Bear ruined the traditional pre-Fed rally. But, not to be outdone, the Fed

Futures up - good or bad?

Image
A likely gap up from the open will leave bulls sweating the first 30-minutes of trading - hoping the inevitable fade won't produce a rout. The 20-day MAs need to be broken soon if this short term bounce in the market doesn't turn out to be just that.

Copper watch...

Image
Last Friday's Jobs Report send bearish ripples through the market, but the real news for February wasn't the jobs report, it was the breakout in copper prices. Many will cite weakness in the dollar as the cause for the surge in commodity prices but this is too simplistic an argument. The following chart shows copper prices priced with respect to the Euro index: Why copper? As a key industrial metal for technology stocks (semiconductors in particular) it is an important measure for early economic expansion. From October through to early February demand for the metal declined as economic conditions deteriorated. However, February saw the start of a recovery over and above a simple decline in weakness for the dollar. If the copper:euro ratio can crack past 2.68 I reckon any chance of a recession will go kaput and it will mark a firm bottom for the markets. Markets discount economic conditions by 6-9 months, so Friday's data was priced in long before it was reported. Breadth

Archive

Show more