Posts

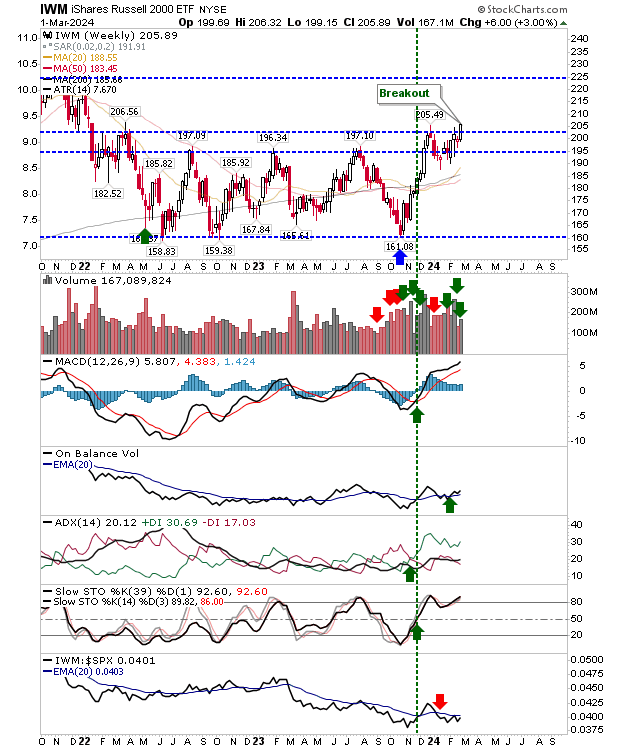
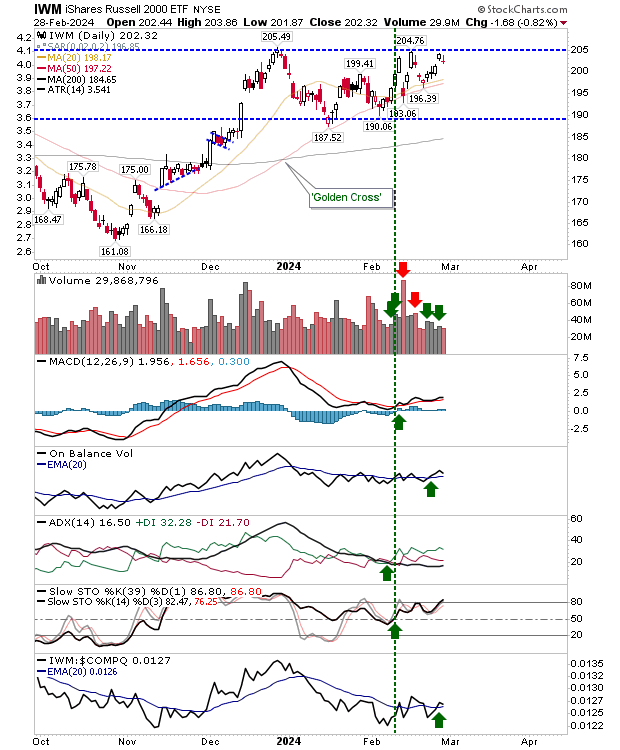
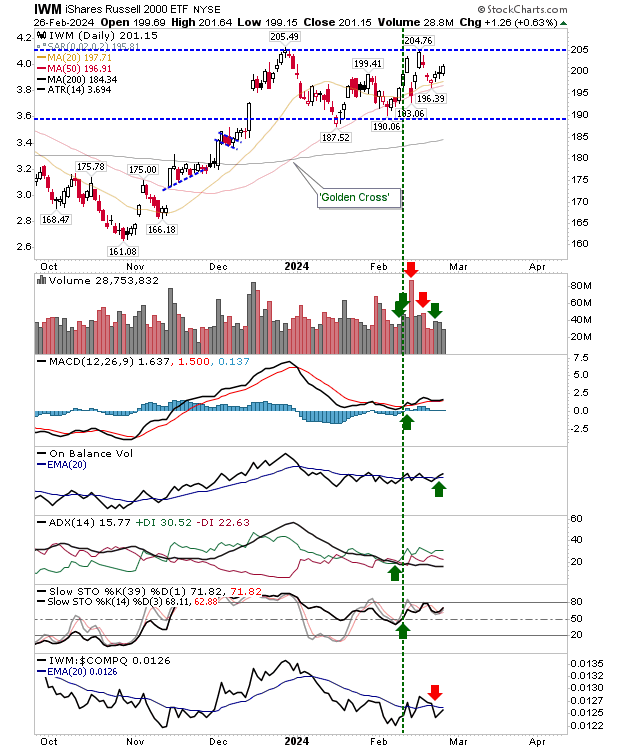
'Bull Traps' are still in play although today registered gains

Image
Today was a bit of a mixed bag with all recording gains (good), but the Russell 2000 ($IWM) finished with a 'black' candlestick (close lesss than open price) that leaves bulls pressured and vulnerable to additiona losses. In the case of the Russell 2000 ($IWM), the losses were not huge and selling volume was light and below the previous day's buying volume. Technicals remained net positive. The 'bull trap' is still the favored outcome following today's action

Warning! Potential 'Bull Traps' across Indices

Image
A couple of days ago we were looking at breakouts, now we need to be watchful for 'bull traps'. We had the first triggers for one with the undercut of breakout support. The next few days will be critical as to whether these undercuts end as 'bull traps', but for now, consider these short signals with stops above the breakout highs. For the Nasdaq, the 'bull trap' came with 'sell' triggers in the MACD, On-Balance-Volume and relative performance to the S&P.

Across the board breakouts for indices

Image
The week finished on a high with breakouts in the Russell 2000 ($IWM), S&P and Nasdaq. The Russell 2000 went a step further with a breakout on the weekly time frame too. The break on the weekly time frame for the Russell 2000 is critical as it marks the start of a right-hand-side base after repeated attempts to clear $195 ($IWM) had failed. If there is a concern (across the board) it's that breakout volume was modest.

Markets respect resistance as gains stall

Image
Up to now, the Russell 2000 ($IWM) had been doing most of the running, marked by the relative performance gains of this index against the S&P and Nasdaq, but today was the first stall in this rally. Technicals for the Russell 2000 are net positive and remain so despite today's loss. The index is well set up for a breakout next week - I wouldn't be too concerned with today's action.

Russell 2000 ($IWM) makes small gains as part of three month base

Image
While the Russell 2000 ($IWM) is not the leading index in the market it performed the best today, and is builidng a nice base after it's initial failure to break to new highs in early February. The Nasdaq and S&P didn't do a whole lot today, but breakouts from February are intact for both of these indices. Technicals for the Russell 2000 ($IWM) returned net bullish with on-balance-volume on a new 'buy' signal. That said, the index is underperforming relative to both the Nasdaq and S&P. While today finished higher, the trading range neutralises the significance of the gain, and only when the range high or low is breached will we have a return to the November-January rally or a shift towards a more bearish stance.

Markets back inside prior consolidations

Image
After the long weekend markets continued to sell off, bringing the S&P and Nasdaq back to breakout support while the Russell 2000 ($IWM) shaped a potential double top. The Russell 2000 ($IWM) has an On-Balance-Volume 'sell' trigger while other technicals are net bullish. However, the reversal off $205 marks a potential double top, one that would be confirmed on a loss of $190.

Breakdown gaps close for S&P an Nasdaq

Image
When the week started with breakdown gaps for the Nasdaq and S&P, it continued with moves to close said gaps, before peaking on Friday and reversing. Consequently, the likelihood of further losses heading into next week is quite high. If we see losses, then 50-day MAs are the likely test. Since 2024, both the S&P and Nasdaq have be holding 20-day MA support, but a fourth test of the latter moving average would likely be a step too far (for the moving average to hold as support). Adding to the selling pressure are MACD 'sell' triggers. And as a final point, the Nasdaq is underperforming relative to the S&P, suggesting that if there is an index to crack first, it will be the Nasdaq.

Archive

Show more