Posts

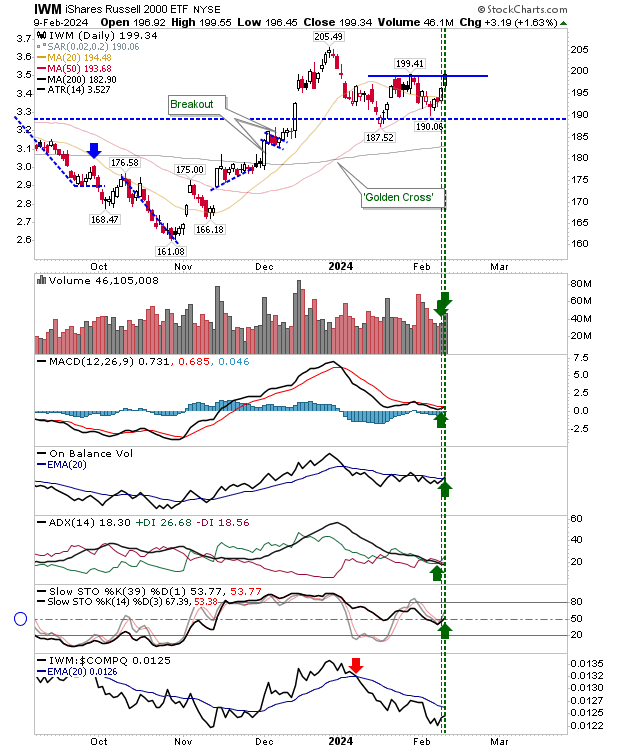
Russell 2000 ($IWM) fails its breakout, dropping back into the prior consolidation

Image
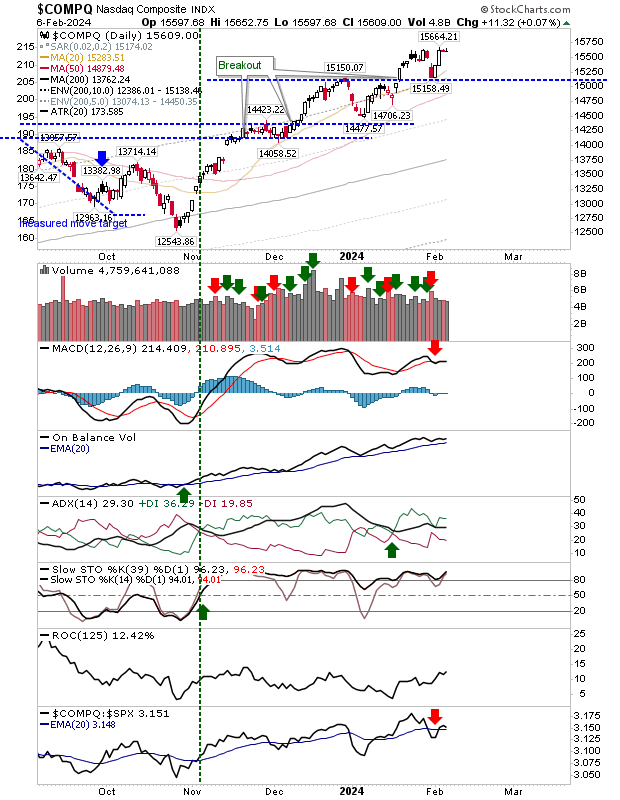
I wouldn't classify it as a "bull trap" as Monday's breakout in the Russell 2000 was an internal base breakout, but the drop back into this base places greater significance on support around $190. Technicals are net bullish, but On-Balance-Volume is flipping around its 20-day MA trigger line and ADX is also a little topsy turvy. The MACD might prove to be the bellwether here, and for now, there is a 'buy' trigger above the bullish zero line. The Nasdaq is recovering from its gap down, although there wasn't too much technical damage from this gap. Symmetry could be important here, and what happened in December could repeat here. If this proves true, the next breakout won't come until March. Technicals support this thesis. For the S&P, read the Nasdaq. Same setup, same potential outcome. The semicondcutor index has been performing relatively methodically, moving in step sequence through its bases. There are bearish diveregences

Russell 2000 ($IWM) Breakout

Image
Friday left the Russell 2000 ($IWM) primed for a breakout and Monday delivered on that setup. By the close of business, the Russell 2000 was left with a bullish " three white soldiers " setup and the potential for more upside. So while the Nasdaq and S&P are near market "extreme" tops, the Russell 2000 is still trading well within itself. Technicals for the Russell 2000 ($IWM) are net bullish and improving, but Monday's volume didn't register as accumulation.

Russell 2000 ($IWM) ready to shape right-hand-side of base

Image
Another solid day on Friday for indices with the Russell 2000 ($IWM) building up some nice momentum, but other indices did not disappoint. The Russell 2000 ($IWM) added over 1% as it reached resistance of the January swing high. Volume climbed to register a second day of accumulation in a row, increasing the probability of a breakout. Technicals returned net bullish with new 'buy' triggers in the MACD and On-Balance-Volume. This technical improvement coincided with a bounce from the intermediate stochastic midline, a typical bounce point in a cyclical bull market. While Monday may not deliver another gain, I would be looking for an end-of-day close near resistance.

A day the Russell 2000 ($IWM) shone

Image
It was a real non-event for the S&P and Nasdaq, so it was left to the Russell 2000 to take up the slack. The Russell 2000 ($IWM) posted a solid gain to keep the momentum going from its successful 50-day MA test. If there was a concern it was that buying volume was a little disappointing, although today's trading registered as accumulation, continuing a trend of weakening volume since the initial sell off spike. Technicals for the Russell 2000 are also net bearish, despite today's gain.

Small gains at 50-day MA for Russell 2000 ($IWM)

Image
A bit of a non-event for the S&P and Nasdaq as both indices closed with tight doji near their highs. There isn't a whole lot more to add for these indices.

The week closed with strong gains on higher volume accumulation

Image
I got burned badly on my day trade expectations for Friday, but it was another solid end-of-week for market bulls. For the S&P, this meant further gains in relative performance over the Russell 2000 ($IWM) on overbought stochastics. The Nasdaq took a slightly longer route to banking its weekly gain, experiencing a weekly intraday spike low. The Nasdaq is outperforming the S&P (outperforming the Russell 2000) and like the S&P it enjoys solid technical strength. I had expected more from the Russell 2000 ($IWM) but it spent another week experiencing further indecisiveness, closing with a "spinning top". However, the end-of-week finish is close enough to $195 support to consider support as holding. Technicals are a little more mixed with On-Balance-Volume switching to a 'sell' trigger as the index underperforms relative to peer indices. As a final note, one index performing well is the Semiconductor Index. It has defended its 20-day MA wi

Bullish Hammer for Russell 2000 ($IWM) at 50-day MA

Image
It was a good finish for the Russell 2000 ($IWM) as the index closed the day with a bullish 'hammer' at its 50-day MA. Taken in combination with yesterday's red candlestick makes a bullish harami, a reliable reversal pattern. The appearance of this candlestick when intermediate stochastics [39,1] are at the midline is another bullish marker. The only negative against a possible bullish day tomorrow is the fresh 'sell' trigger in the MACD.

Archive

Show more