Popular posts from this blog
Small gains at 50-day MA for Russell 2000 ($IWM)
- Get link
- X
- Other Apps
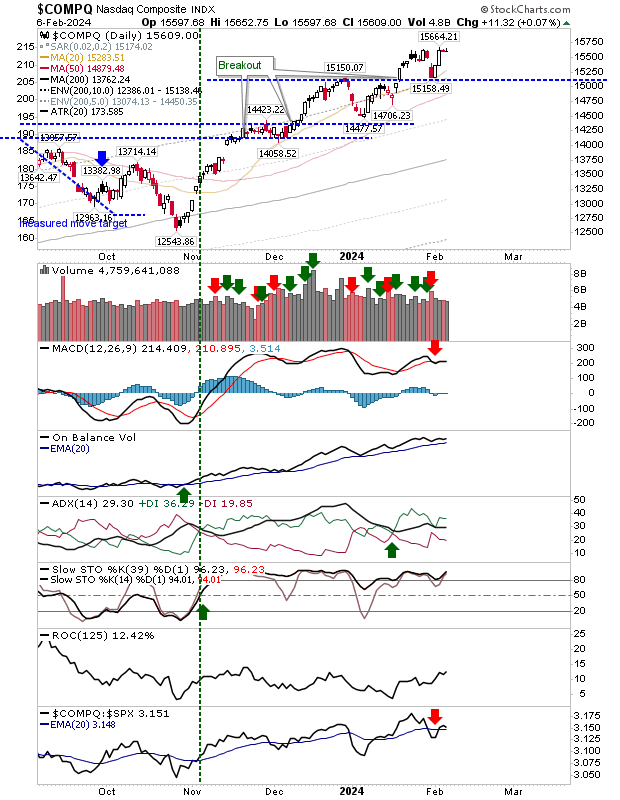
A bit of a non-event for the S&P and Nasdaq as both indices closed with tight doji near their highs. There isn't a whole lot more to add for these indices.
The Russell 2000 ($IWM) managed to deliver a little more upside with a successful test of its 50-day MA. However, volume was well down on what I would like to see for a successful support test.
I follow J.C. Parets and he has noted the breadth weakness in this rally. This is apparent in the Percentage of (Nasdaq) Stocks above the 50-day MA, 200-day MA, Bullish Percents Index and Summation Index, all of which are showing a bearish divergence.
Given the breadth picture (in the Nasdaq), expectation is that tight trading will eventually give way to selling, or catch bulls off guard with a 'bull trap'. I would expect this selling to spill across indices, but let's see what the market brings.
---
Investments are held in a pension fund on a buy-and-hold strategy.
- Get link
- X
- Other Apps
Popular posts from this blog
Upcoming "Death Cross" for Russell 2000 ($IWM)
"Dead Cat" Bounce or Something Better?
"Bull Traps" For S&P, Nasdaq and Bitcoin
Archive
Archive
- April 202511
- March 202511
- February 20259
- January 202510
- December 20248
- November 20247
- October 202412
- September 202411
- August 20246
- July 202413
- June 202410
- May 202411
- April 202415
- March 202410
- February 202411
- January 202413
- December 202310
- November 202311
- October 202311
- September 202311
- August 202312
- July 202311
- June 20235
- May 202313
- April 20239
- March 202313
- February 202312
- January 202312
- December 202213
- November 202210
- October 202212
- September 202213
- August 202212
- July 20221
- June 202212
- May 202213
- April 20229
- March 202211
- February 202211
- January 202213
- December 20219
- November 202112
- October 202113
- September 202111
- August 202110
- July 202114
- June 202112
- May 202113
- April 202113
- March 202114
- February 202111
- January 202112
- December 20209
- November 202012
- October 202012
- September 202014
- August 202011
- July 202010
- June 202013
- May 202012
- April 202014
- March 202015
- February 202011
- January 202012
- December 201910
- November 201912
- October 201913
- September 201913
- August 20198
- July 20198
- June 201912
- May 201912
- April 201914
- March 201913
- February 201911
- January 201914
- December 201810
- November 20187
- October 201814
- September 201815
- August 201810
- July 201813
- June 201812
- May 201815
- April 201816
- March 201813
- February 201812
- January 201814
- December 201711
- November 201718
- October 201717
- September 201715
- August 20178
- July 201713
- June 201716
- May 201715
- April 201715
- March 201720
- February 201710
- January 201718
- December 201614
- November 201617
- October 201612
- September 201610
- August 201614
- July 20163
- June 201616
- May 201618
- April 201618
- March 20168
- February 201620
- January 201620
- December 201513
- November 201518
- October 201516
- September 201518
- August 201517
- July 201519
- June 201518
- May 201521
- April 201520
- March 201522
- February 201518
- January 201518
- December 201413
- November 201417
- October 201420
- September 201421
- August 201420
- July 20148
- June 201420
- May 201420
- April 201421
- March 201420
- February 201418
- January 201422
- December 201320
- November 201321
- October 201322
- September 201325
- August 201317
- July 201311
- June 201320
- May 201317
- April 201319
- March 201318
- February 201324
- January 201321
- December 201218
- November 201223
- October 201224
- September 201225
- August 201225
- July 201215
- June 201218
- May 201224
- April 201225
- March 201222
- February 201219
- January 201217
- December 201114
- November 201119
- October 201121
- September 201119
- August 201122
- July 201121
- June 201120
- May 20117
- April 201119
- March 201125
- February 201121
- January 201125
- December 201019
- November 201021
- October 201022
- September 201025
- August 201010
- July 201029
- June 201025
- May 201022
- April 201022
- March 201030
- February 201023
- January 201026
- December 200922
- November 200923
- October 200923
- September 200926
- August 200927
- July 200921
- June 200939
- May 200932
- April 200939
- March 200936
- February 200933
- January 200935
- December 200823
- November 200823
- October 200821
- September 200821
- August 200822
- July 200823
- June 200828
- May 200823
- April 200822
- March 200828
- February 200824
- January 200826
- December 200719
- November 200721
- October 200729
- September 200724
- August 200729
- July 200720
- June 200734
- May 200742
- April 200740
- March 200734
- February 200738
- January 200732
- December 200635
- November 200630
- October 200650
- September 200646
- August 200641
- July 200648
- June 200637
- May 200653
- April 200645
- March 200648
- February 200645
- January 200635
- December 200543
- November 200535
- October 20058
- September 20058
- August 20059
- July 20057
- June 200510
- May 20053
- April 200510
- March 20058
- February 200516
- January 200529


