Posts

Tight trading near highs keeps momentum bullish for indices

Image
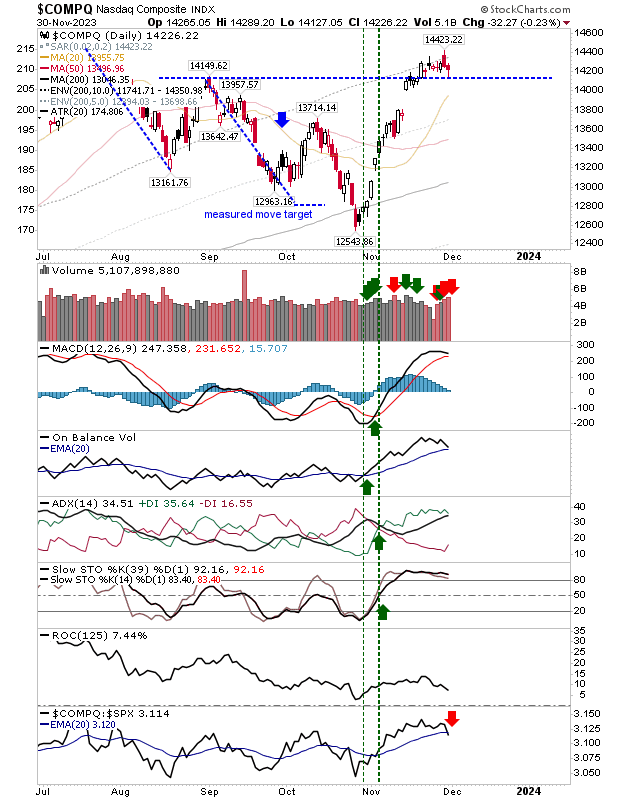
Markets are trading near resistance defined by recent swing highs, reversing eary losses. The S&P opened on resistance and posted a small gain. The Nasdaq had opened at support and has moved to trading range resistance. In process of making today's gains there was a switch in relative strength back in favor of the Tech index. There is still a MACD trigger 'sell' to negotiate, but this signal occurred well above the bullish zero line.

Russell 2000 pegged by minor resistance as Nasdaq and S&P hold breakout support

Image
The Russell 2000 ($IWM) posted two days of strong buying that brought the index up towards minor resistance. Not surprisingly, after days of narrow action into the prior ascending bullish triangle consolidation the resulting price surge has entered a new consolidation period. Technicals for the index are strongly net bullish, but even with the loss, prices are still near highs of the last couple of days.

Russell 2000 ($IWM) smashes a breakout

Image
After weeks of toying with the 200-day MA, the Russell 2000 ($IWM) pushed through this moving average with ease on higher volume accumulation. Tehnicals have been net positive since the start of the bullish ascending triangle, but Friday's move has not only cleared price resistance it has also managed to accelerate relative outperformance against the S&P.

Markets in "covered call" territory

Image
Bulls have managed to retain control of their powerful rally off October lows. Shorts looked ready to attack with yesterday's bearish 'cloud cover' candestick in the Nasdaq and S&P, but today's action has managed to counter that without really changing the larger picture. If you held index ETFs then current action would be a decent opportunity to sell covered calls against your position. There may be some pullback, but it's hard to see any selling going all the way back to those October lows.

Another day waiting for the breakout in the Russell 2000

Image
It has been a relatively slow start to the week given what is at stake we remain waiting for the potential breakout in the Russell 2000 ($IWM). The Russell 2000 has drifted back in relative underperformace against the S&P, but only to a small degree. Other technicals remain net positive. The Nasdaq and S&P both closed higher. Not enough to kick start a continuation of the rally, but the sizable gaps from early November for both indices have the look of measuring gaps, and this means there is still more to come for these indices. I remain optimistic for the Russell 2000, but it's feasible we will see moves higher in either the S&P or Nasdaq before then. Bulls hold all the cards at the moment, quite the change from late October. Get a 50% discount on my Roth IRA with a 14-day free trial. Use coupon code fallondpicks at Get My Trades to get the discount. --- Follow Me on Twitter Investments are held in a pension fund on a buy-and-hold strateg

Bullish ascending triangle for Russell 2000 ($IWM)

Image
Whether you see the past week-and-a-half action in the Russell 2000 as a bullish ascending triangle or pennant, it's clear there is a significant bullish turn in momentum since the early November gap higher (on higher volume accumulation). Obviously, we can't read too much into Black Friday's trading, but we have a broader bullish picture on net bullish technicals. Even relative performance against the S&P looks to be turning in bulls favor. The only key resistance level left to break is the 200-day MA, and it is interesting that prices have stayed consistently below since the failed attempt on the inverse hammer spike. While the Russell 2000 sets up for a bullish week, other indices reached a logical end point of their October-November rally. For the Nasdaq, a sequence of narrow range days above the August swing high has the potential to generate a 'bull trap' that would leave shorts with a trade (to the 20-day MA). Likewise, for the S&P, w

Minor losses for indices change little for the big picture

Image
While coming in as a technical distribution day, the general low volume is a sign that Thanksgiving trading has come early. I won't be expecting much until next Monday, but Black Friday is more likely to be bullish. The Russell 2000 ($IWM) experienced the larges loss. The 50-day MA is a potential support area although it may not be needed.

Archive

Show more