Posts

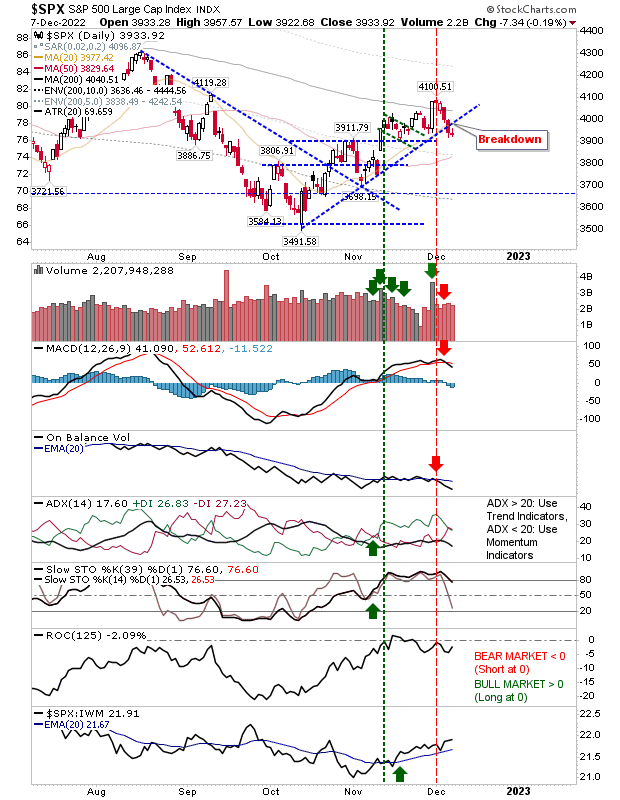
Has the S&P found support?

Image
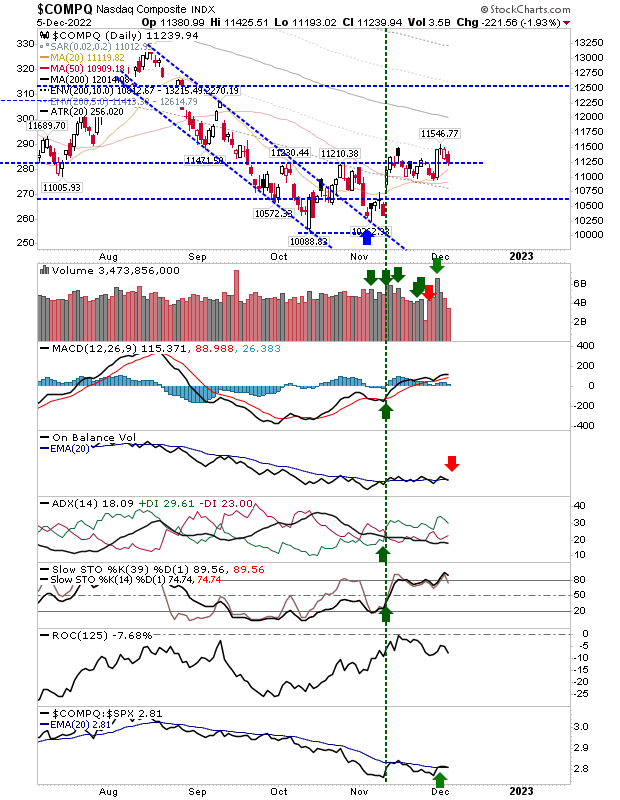
Each of the lead indices have their own support levels to defend, not all tested at the same time.  On Friday, it was the Nasdaq toying with potential trading range support, today it's the turn of the S&P.  These support levels I'm looking at are not major areas of demand, but a guide as to *where* demand might kick in.  So with that, we have the S&P which is down testing neckline support from October with technicals net bearish, but not oversold. Price trumps technicals, so even given the weak technical picture there is a good chance we could see a bounce tomorrow - an aggressive long trade.

Indices feel around for support as quad witching muddies the water

Image
Friday's quad witching (of options expiration) made it difficult to confirm the significance of the day's trading action. Some indices continue to work with areas of support - I think - are valid.  Others, not so. The Nasdaq tagged support with a candlestick which is not typically associated with a reversal - a more neutral 'spinning top' - that leaves things open for Monday.  However, technicals are net bearish which guides in favor of bears and further losses. 

Sellers peg attempts to rally, but trading ranges emerge

Image
Tuesday's 'black' candlesticks were the red flag for bulls - as often they are - when the sizable opening gaps were quickly pegged back, and in the days that followed, sellers were able to continue with the selling, leading to today's losses.  The net effect of this is that indices are evolving from an attempted recoveries off October/November lows into broader sideway ranges.  For the Russell 2000, the index is back at former resistance from the October low - now support - in confirmed distribution. There is an opportunity to dig in at support, even allowing for an intraday spike below this support for tomorrow's trading.

Bulls have the Dow Industrial Average to appreciate

Image
While last week had a disappointing finish for bulls watching the S&P, Nasdaq and Russell 2000 - there is the Dow Jones Industrial Average to provide some pep-in-the-step.  Today's gain was greatest in the Dow (vs the other, aforementioned indices) and has a solid setup for a challenge on the 'bull trap'.  Today also registered as an accumulation day - if only other indices were so good at challenging their past highs. 

A soft close didn't deliver the required end-of-week buying.

Image
The week started with selling but when it came the turn of buyers they failed to show.  Friday was the icing on the cake as whatever small gains were achieved during the week were snipped back.  The Nasdaq is still holding on to its 50-day MA, with Rate-of-Change crossing the bullish 'zero' line as part of a breakout in this indicator.  On the flip side, the ADX, On-Balance-Volume and the MACD are all on 'sell' triggers.

Markets reach their low for the week - now for the rally...

Image
As stated last week, what happens by the close on Friday will have greater significance than how the week started. As things stand now, we are looking at a bearish reversal at resistance that points to a larger retest of the October low.  However, all is not lost. The S&P finished today with a doji following two days of selling which concluded with a break of rising trendline support.  There is a MACD and On-Balance-Volume 'sell' trigger to work off if there is to be a bullish finish to week.  If bulls are to pull this off, then tomorrow needs to see buying throughout the day and at least a close above the 200-day MA. 

A weak start to the week, but this is not important

Image
We don't want to dwell too much on today's action, although at the same time, we don't want the selling to get away from us. Sellers were able to push markets lower on light volume.  The Nasdaq drifted back to support, but was able to hold the prior support level (at least, support before the 'black' candlestick appeared).  There was a 'sell' trigger in On-Balance-Volume but there is a large degree of whipsaw in this indicator since the swing low in November.  There is a modest uptick in relative outperformance against the S&P which may help the index build out from its November bottom, but this nascent trend needs to continue.

Archive

Show more