Posts

Market declines continue

Image
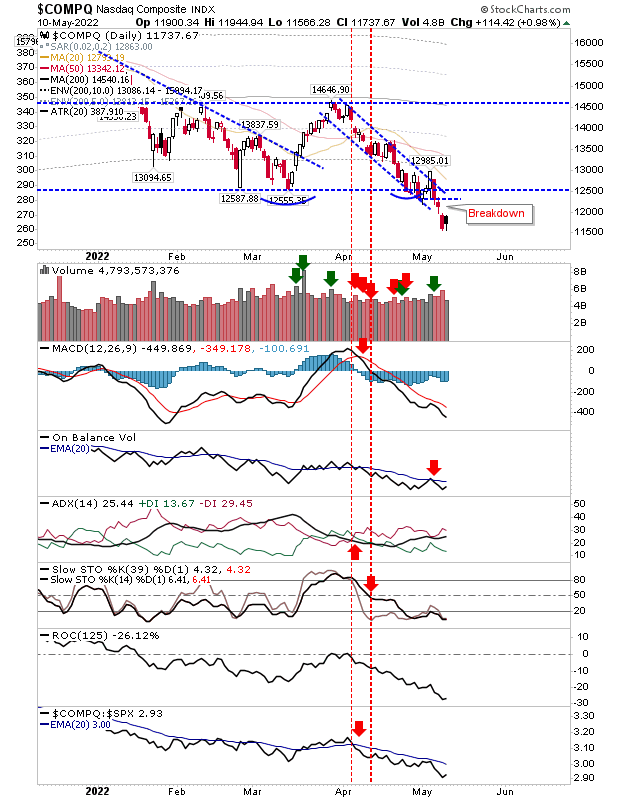
With the losses adding up we can start tracking the relative performance of the indices against their 200-day MAs.  We can see from the table below how the relationship of the indices to their 200-day MAs compare historically.   The Nasdaq is 21.6% below its 200-day MA, which puts it into the 5% zone of historic price weakness and is a "Strong Buy".  The S&P is 12.3% is below its 200-day MA, which is also in the 5% zone of historic weakness.  Finally, the Russell 2000 is 18.4% is below its 200-day MA, which is also the 5% zone.  For each index, we are repeating the action of the Covid 2020 sell off, and the Russell 2000 is only a few percentage points away from the 1% zone and a "Very Strong" buy.

Sellers Press Their Advantage But Buyers Hold Long Term Advantage

Image
Whatever hope bulls were hanging on too was quickly quashed by yesterday's gap down and today's trading different bail them out.  The Nasdaq did a little better by closing with an (potential reversal) inside day. A gap higher would offer the possibility for a bullish morning star - not to be discounted as a trading opportunity.  No surprise to see technicals net bearish with momentum oversold.

Markets Hanging On - Just

Image
Markets lost more ground on Friday, but the extent of losses was not enough to suggest there was a confirmed break of support across indices - although some are closer to others. The Nasdaq had the worse of Friday's action as it undercut the existing May low with a small candlestick, but one which left any buyer of the index for 2022 in the red - not exactly one to build confidence although some breadth metrics are already at levels where reversals happen .

Neutral stance for markets

Image
Markets gained yesterday and lost today, leaving things in a can/can't do situation. If I was to stick my neck out I would say this is part of a swing low and not a fresh move lower, but a close below recent lows ( not an intraday spike low) would leave me with egg on my face.  The Nasdaq enjoyed an accumulation day yesterday, but today's losses didn't rank as distribution despite losing close to 5%. The index is still underperforming relative to the S&P, but the index is oversold.

Despite the buying, breakdowns remain

Image
Last week closed with sellers in control and this pessimism was reflected in the buying of the last two days.  The Nasdaq had undercut March lows and had managed a day of accumulated buying yesterday, but today's neutral doji marked doubts on behalf of buyers. Technicals are net bearish, but there is a slowly improving relative performance for the index which may be reflected in the Nasdaq over the coming days. 

February lows undercut - new lows beckon

Image
Friday saw the end of support from Februray and March swing lows as sellers closed the week in total control.  We now have to consider the possibility of measured move lower.  Some indices are closer to this target than others. The nearest measured move target is the S&P.  It's target is 3,977 which is only one or two days worth of selling to get there; this level was formerly resistance in January 2021 and now has the potential to be support. On the weekly chart, momentum is not entirely oversold and ideally I would like to see it tag a level last seen in March 2020.  

A last chance saloon for indices

Image
The Monday reversal wasn't enough to light a fire under bulls as sellers quickly returned to reverse all of that gain.  Indices are now left with just the lows of February to hang on too, but even that is under pressure for the Russell 2000. The Russell 2000 had looked like it was going to lead a recovery when it broke out of its base in March, but the resulting 'bull trap' did what most 'bull traps' do and reversed all the way back to the lows of the base and then break support. Technicals are net bearish but momentum is at least oversold - although price crashes occur from an oversold condition. Because we have a test of support there is a buying opportunity, but keep the stop tight. 

Archive

Show more