Posts

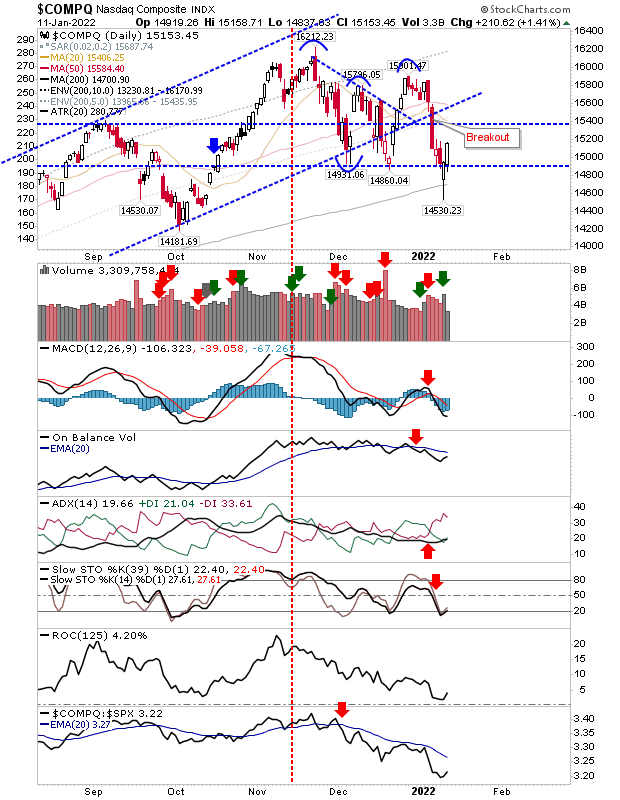
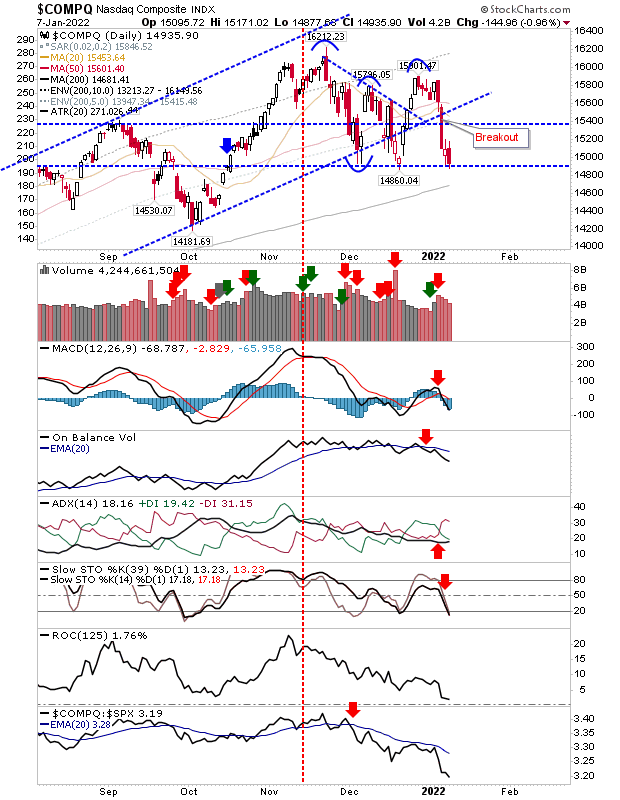
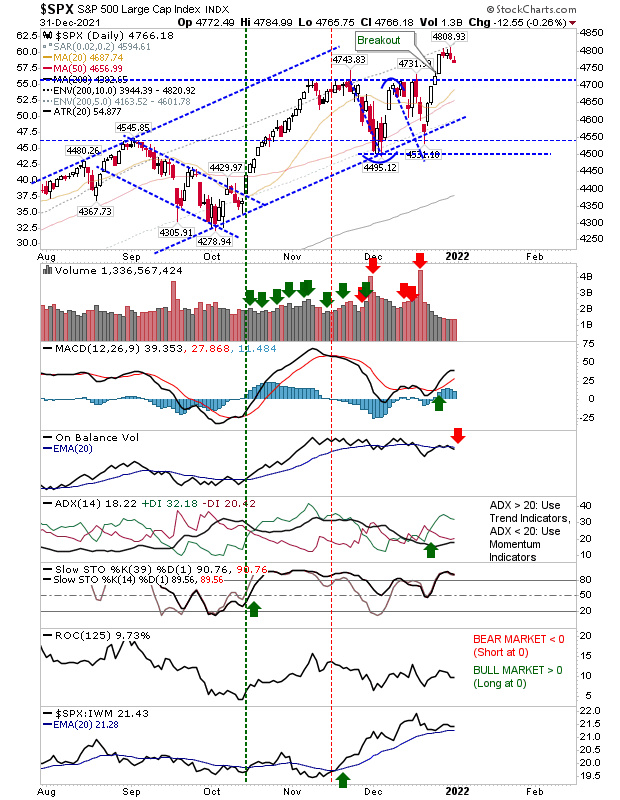
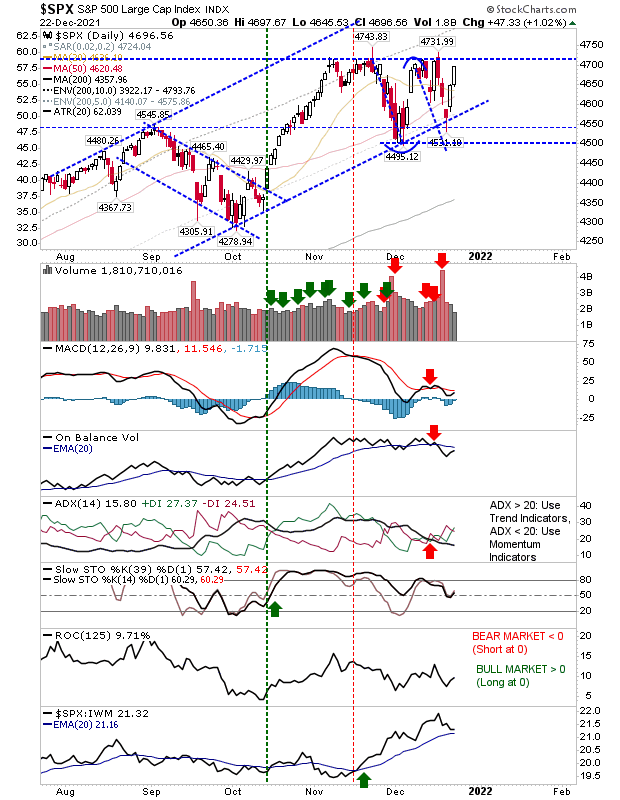
Relief Rallies stall for now

Image
No surprise given the selling which has come before that the nascent rallies now find themselves moving into areas of prior supply. Today's candlesticks are not great but are more neutral in tone than outright bearish. For the Nasdaq, we had a bearish 'black' candlestick below all key moving averages. Supporting technicals are all bearish and there hasn't been enough of a recovery in relative performance to suggest this bounce can last much longer.  

Swing Lows Take Shape Across Indices

Image
Today effectively confirmed the swing low is in development across indices, but it's still early days if today's buying is to be reflected in a rally. The first challenge is to make it back to the last swing high.  For the Nasdaq, this means mounting a challenge of 16,000 as the 200-day MA has played as a launch point for this swing low.  Technicals remain net negative. 

Nasdaq challenging support for a third time

Image
Well the Nasdaq wasn't able to break through 16,000 resistance, it's now looking at cutting below 14,900 support.  The 200-day MA is nearby at 14,681 and is looking a more likely support test that maintaining current levels.  Not surprisingly, there was an acceleration in the relative loss of the Nasdaq to the S&P with technicals net bearish.  Volume is a balance between sellers and buyers and the likelihood is that we have trading range in development.

Sellers pay a visit, pushing markets back into prior ranges

Image
One step forward, two steps back.  The only consolation to today was that trading volume was down on yesterday's.  The Nasdaq is holding circa 14,900 support whie the S&P was able to find buyers around its 50-day MA - but not before it undercut breakout support. Meanwhile, the Russell 2000 didn't make it past neckline resistance.  Despite the loss of breakout support the S&P has two chances to recover the losses; the first is where the index finished today - at its 50-day MA, the second is channel support - currently around 4,650.  We do have 'sell' triggers in the MACD and On-Balance-Volume, but momentum remains on the bullish side of the midline.

Volume returns but market direction remains elusive

Image
With Christmas behind us, traders made their return but control of the market has not yet been decided. The best of the action came in the Dow Jones Industrial Average as it broke resistance of the potential 'double top' on higher volume accumulation. Technicals are net positive and the index is making a relative gain to its peers. Will this strength feed into the S&P?

New Year - Fresh Outlook

Image
While trading volume was down over the holiday period, there were significant technical changes as resistance was challenged and broken across lead indices.  The biggest move came with the S&P as it pushed above 4,725 and managed to retain this key breakout with modest losses over last week. The big question is whether it will be able to hold this breakout once traders return from holidays.  In support of this was a MACD trigger 'buy', an acceleration in trend strength as measured by ADX, and a return to overbought conditions (in momentum) - necessary for a sustained rally. The index is still outperforming the Russell 2000, but it is losing ground to it.  It's an important move and one which could set up a positive quarter - but it needs some volume buying to back it up and we haven't had it yet, as noted by the 'sell' trigger in On-Balance-Volume. 

Indices Shift To Trading Ranges

Image
The past few days has seen indices rally back to resistance, or at least reaffirmed support. Given the action, it's looking increasingly likely this status quo will continue through to the end of the year and it will be the New Year before there is a decisive move one way or the other. For the S&P, this measn we have a trading range defined by the highs of November and the swing lows of December.  Another tag of resistance would likely mean a breakout will follow as triple tops are rare and it seems unlikely we would see one here.

Archive

Show more