Posts

Indices Repeat Friday's Action - Russell 2000 leads

Image
Monday registered further gains, but buying volume was light. The biggest gain was the Russell 2000 as it added 2.65% on an acceleration of the gains. This was enough to return a new 'buy' signal in the MACD, returning technicals as net bullish.

Friday's Market Doji Point To Indecision

Image
We closed the week with small doji at the top of recovery rallies for the Nasdaq, S&P and Russell 2000.  This candlestick is typically neutral, but given what's come before I would view these candlesticks with a more bearish bent. The S&P has returned to a net bullish stance in supporting technicals, although relative performance against the Russell 2000 actually ticked away from a possible new 'buy' signal.  While Large Caps are still lagging Small Caps they still have the benefit of a new all-time high to work off.  Buying volume across last week was light; this will need to pick up if all-time highs are to be maintained. What should work in its favour is the 'bear trap'; this will have pushed some traders on to the wrong side of the trade, forcing them to cover (or go long again) if they haven't already. 

Russell 2000 and Nasdaq at new highs

Image
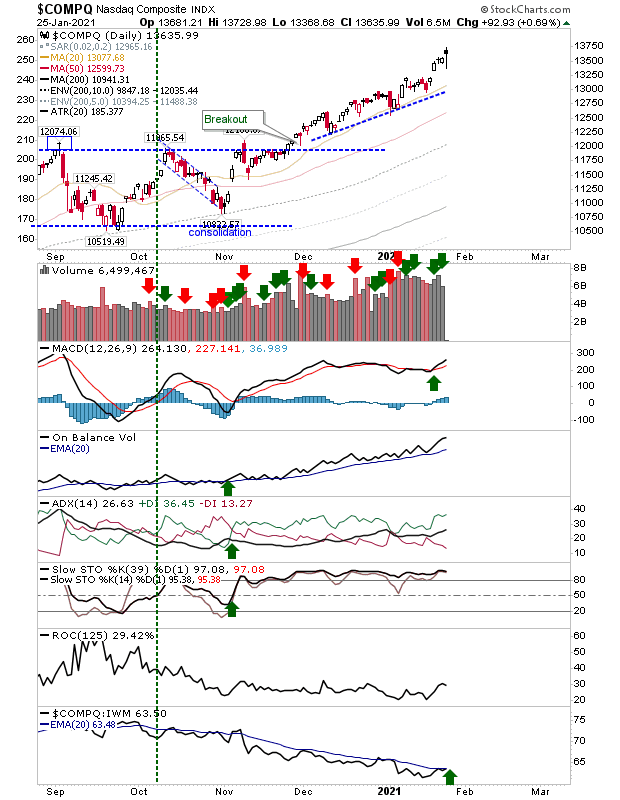
The Nasdaq and Russell 2000 both enjoyed pushes to new all-time highs, albeit on relatively light volume. Despite the gain, the Nasdaq lost relative ground against the Russell 2000 but the gain keeps the November trend running.  Technicals returned to net bullish. 

Bulls are trying to stage a recovery

Image
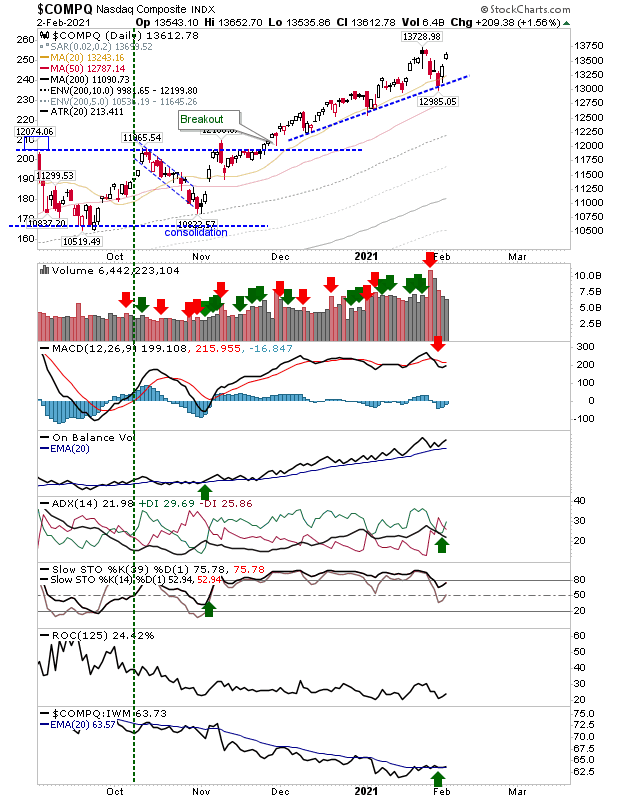
There is still work to be done but indices are trying to make back lost ground from last week. If there is a concern it's that buying volume wasn't great. We will start with the Nasdaq; Friday's selling drove price action into the rising trendline, while Monday delivered a recovery. The swing high from January hasn't yet been challenged. Only the MACD is on a 'sell' trigger and it will take more than a couple of days of buying to bring this back into net bullish territory. 

S&P breaks rising support, Nasdaq sits on support

Image
I doubt anyone wants to read about anything else but Gamestop stock, but the broader market marches on.   The S&P is trading at its 50-day MA after undercutting rising support on Friday.  There was a break of the mid-line in Stochastics, but technicals are not fully bearish with On-Balance-Volume still to flag a 'sell' trigger.  On a positive note, the S&P is making up ground against the Russell 2000.

Sellers step in to create some distance from recent swing highs

Image
Semiconductors suffered heavy selling which broke support of the rising wedge in a 5% loss. This had obvious knock on effects to other indices such as the Nasdaq and S&P. It's too early to say if this is the start of a major swing high or just a heavier than expected selling day. The key thing from the Semiconductor Index is the gap down from the sell off, breaching support and the 20-day MA undercut. If this is a significant breakdown, then the gap can't be closed (and really, shouldn't be challenged). It's going to take a few weeks for this to recover, even if it does recover. Semiconductors have come a long way in the last five years, but now looks a time for a period of sideways action. 

Prices drift modestly higher on light volume

Image
There was a relatively wide intraday range day for markets, but by the close of business most indices were back where they started.  The biggest gain came from the Nasdaq, but it closed with a doji at a swing high. This is typically a neutral candlestick, but can also mark a reversal. The Nasdaq is starting to run a relative performance advantage over the Russell 2000.

Archive

Show more