Posts

Russell 2000 Breaks Out

Image
Friday belonged to the Russell 2000 ($IWM) as it cleared resistance on higher volume accumulation. It was the index to do most of the work, and is also the index which is the most extended from its 200-day MA.

Small Changes Don't Make Headlines But Breakouts Maintained

Image
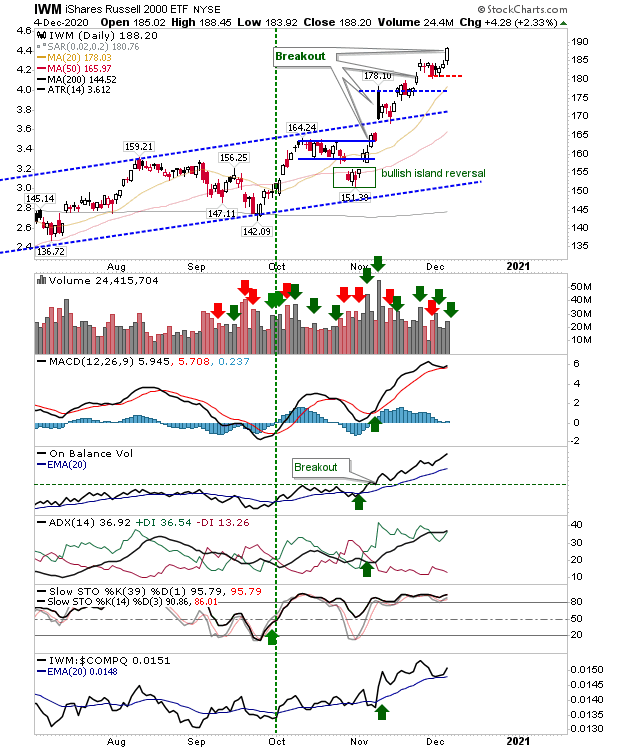
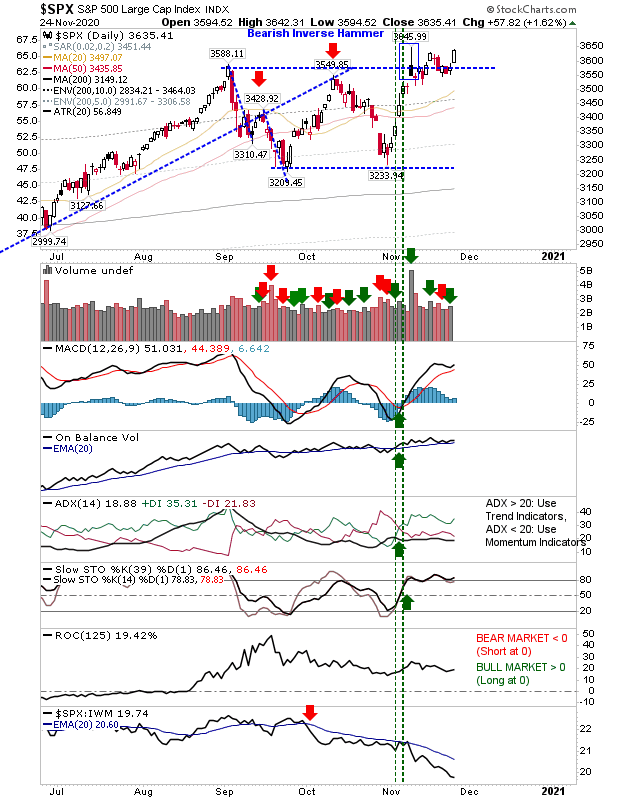
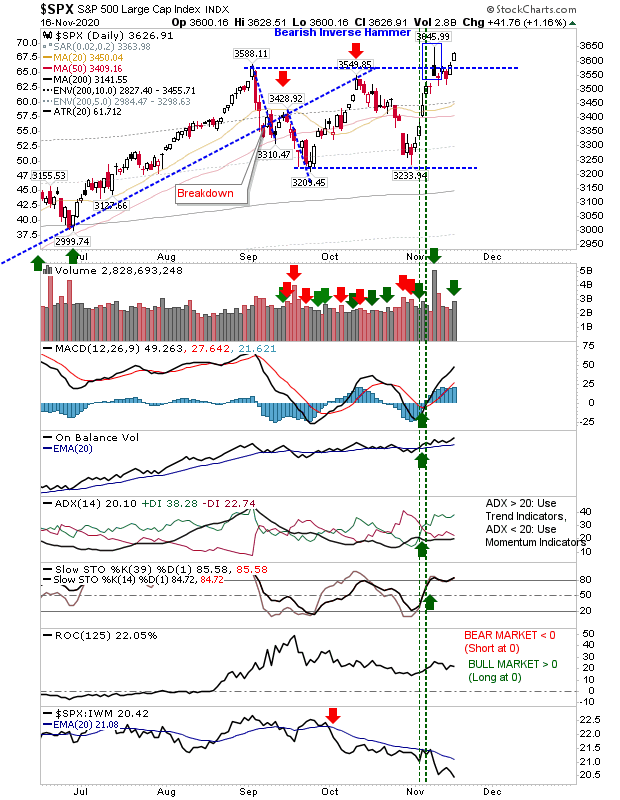
Today's action was quietly bullish. The fact none of the indices lost significant ground after pushing breakouts is of greater significance - suggesting few traders are willing to sell. As we approach end-of-year we have the Santa rally to look forward too. In reality, if sellers do make an appearance then we will want to see breakout support hold on a test (should a test occur). The Nasdaq is making up lost ground against the Russell 2000 as other supporting technicals remain net positive. The September high has been breached, neutralizing the outlook for a major top then, but with the index now riding 18.2% above its 200-day MA we now have to consider a new major top count; currently, we are in the 90% historic range of overbought action. 

Russell 2000 sees some selling

Image
There wasn't too much damage done to the gains made on Friday's junior trader watch. Volume was up significantly across indices to register today as a distribution day, but the relative price loss was small.  Only action in the Russell 2000 left a mark on the chart. Even with the selling in the Russell 2000, it remained well above breakout support and held a significant performance advantage relative to the S&P and Nasdaq. Technicals remain favorable with no major bearish divergences to be concerned with. 

Nasdaq and S&P make key gains

Image
Important day for the indices with the S&P again pushing into the spike high of the Bearish inverse hammer. Volume climbed to register an accumulation day as buyers found some footing on the back of bullish net technicals.

Russell 2000 Holds Gains

Image
There wasn't a whole lot of change to the week for indices but it was good to see the Russell 2000 hang on the gains generated by Monday's gap higher. Better still, it looks to have killed the bearish implications of the previous week's bearish black candlestick. All we need now is some follow through higher, helped by some strong technical support - including excellent relative performance.

S&P and Nasdaq Again Can't Get Past September Highs

Image
Why the focus on the September highs? Because they came with extremes in breadth metrics for the S&P and Nasdaq - marking levels typically associated with a major top. The action from Monday had looked like it was going to end the consolidation established from the September peak but again it was not to be. Today is not the start of a crash, but it is disappointing.  The S&P is back at breakout support on the back of heavy volume distribution. The loss added to the relative loss against the Russell 2000. While today marked a loss, the presence of support hasn't totally negated bullish opportunity. 

Indices Recover Lost Ground

Image
Another bright start to the week on more positive Covid19 vaccine news. Today's gain was accompanied with higher volume accumulation across indices, setting them on course to negate the ultimate bearishness of last Monday's candlesticks - despite the initial positive vaccine news then.   For the S&P, while today's gains pushed it well inside the spike high of the inverse bearish hammer, relative performance against the Russell 2000 took a big step lower. Under these circumstances, this may be seen as bearish but Small Cap leadership is critical to the success of any long term bull market. We will have to wait and see what the rest of the week brings. 

Archive

Show more