Posts

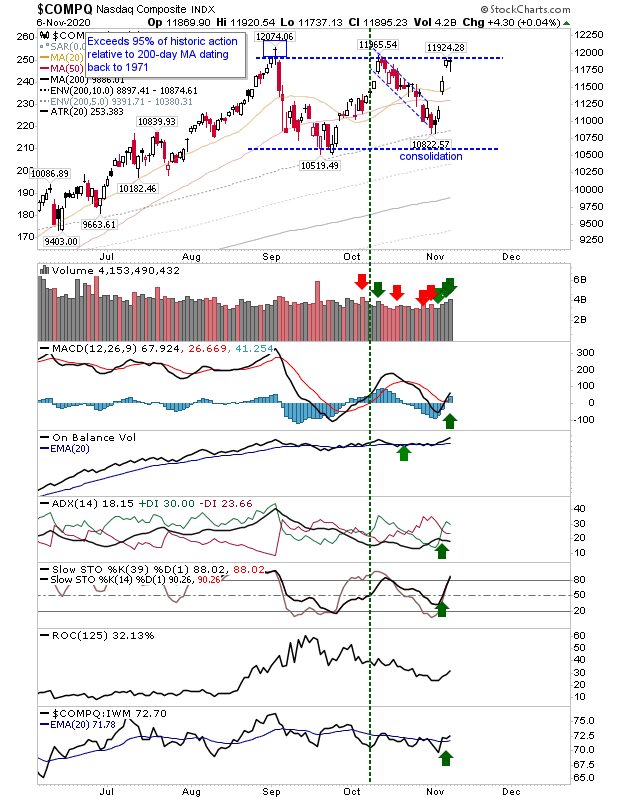
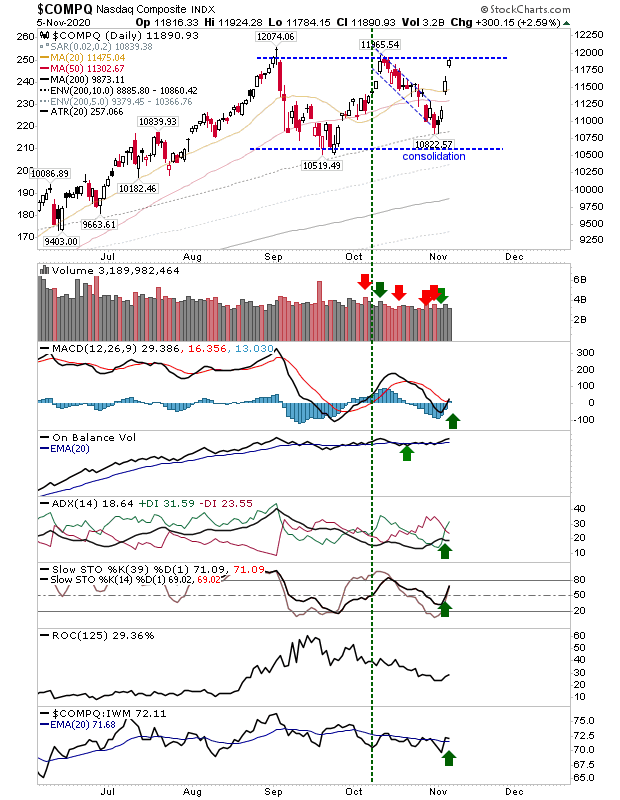
S&P and Nasdaq can't break September swing high

Image
It was another struggle for the S&P and Nasdaq as they tried to get past the swing high of September. Only the Russell 2000 is showing signs of relative and price strength, which is good, but broader participation is required if those gains are to stick.  The Nasdaq has fallen inside the prior trading range established from September. While triple tops are rare we are looking at the possibility of one here. Today's bullish 'hammer' may offer a launch point to challenge the bearish engulfing pattern high - which would be enough to restate a breakout.  Not surprisingly, there was a large drop in relative performance to the Russell 2000. 

Waiting On Russell 2000 Leadership

Image
The Nasdaq looked like it was going to breakout on Friday and take out the key swing high from September. It wasn't able to do so then, and it may do so Monday, but until then we have to wait-and-see. Volume action is healthy with increase buying and net bullish technicals. 

Recent Buying Remains Range Bound

Image
Election week buying has managed to undo much of October's selling, but for all the enthusiasm it doesn't change the broader consolidation which is an index caught between Autumn peaks and swing lows. Technicals for the Nasdaq returned to a net bullish picture but the index now finds itself back at - what had looked to be - a double top. As J.C. Parets has noted, how many times do you see a triple top? Not very often, so we must consider this test of resistance is part of a larger move higher. 

Market Bounce Attempts To Firm Lows

Image
Buyers made a return to markets before heading to the polls. There wasn't a whole lot of volume to today's action but it was enough to mark the action of the previous few days as a possible swing low.  The S&P was one of the stronger indices in its reaction off support. However, it now finds itself coming up against resistance of its 20-day and 50-day MAs. On a positive front, there was a 'buy' trigger in On-Balance-Volume, albeit a weak signal from a flat-lined trend. Relative performance was skewed heavily away from Large Cap stocks. 

Archive

Show more