Posts

Buyers Keep The Pressure Up

Image
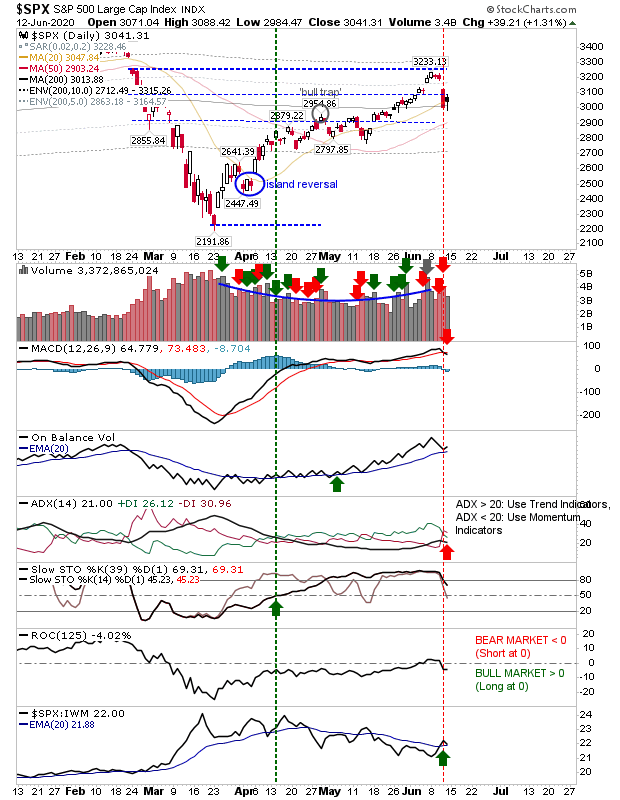
Friday's defensive action was followed by Monday's buying, with many indices defending 20-day MA support. The profit taking from Thursday is still in the mix but the panic selling from February hasn't materialized. Indices finished with possible bullish engulfing patterns, but the lack of oversold conditions weakens the signal.  The S&P didn't reverse the 'sell' triggers in the MACD and ADX and left a new underperformance signal relative to the Russell 2000. 

Friday's Recovery Pauses The Profit Taking

Image
Traders took stock on Thursday's sharp falls with some modest buying. Collectively, Thursday-Friday's paired action might be viewed as a bullish harami across indices, and therefore a swing low. But, I would like to see markets oversold for this to be a proper swing low and this is not the case for markets now.  The S&P fell back to its 20-day MA but is caught between support and resistance. Technicals are a mix of bullish and bearish indicators with 'sell' triggers in the MACD and trend measure, ADX (-DI > +DI). However, bullish is the accumulation trend in On-Balance-Volume and the relative outperformance against the Russell 2000 (although this is bearish for the broader market, at least it's bullish for safety conscious Blue Chip stock buyers). 

Minor Changes as Small Caps Suffer The Most

Image
With some indices at resistance today's selling was not a surprise. Hardest hit by the selling was the Russell 2000, it lost over 2% as it reversed off the March swing high. Volume climbed in confirmed distribution, but aside from the relative strength loss against the Nasdaq, other technicals were positive. While the selling was heaviest in this index it didn't breacelletnt support. 

Nasdaq Breakout

Image
Today's gains were small but they were enough to see a breakout in the Nasdaq. Buying volume was down on yesterday's but heavier than usual.

Archive

Show more