Posts

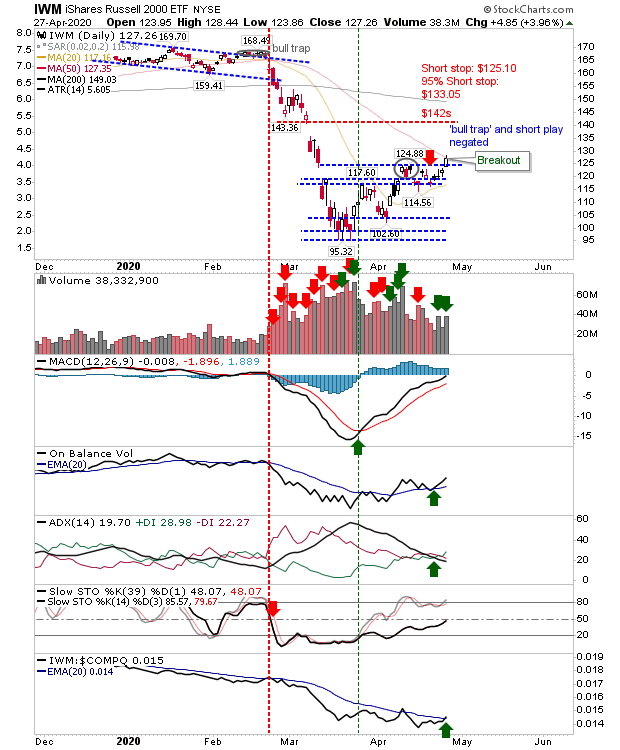
Small Caps Continue to Make The Running

Image
The Market has finally noticed the value in Small Caps and added nearly 5% in a drive towards its 200-day MA. The index is still lagging a long way behind the Nasdaq and S&P but has at least enjoyed a relative performance advantage.

Small Caps Finally Breaking Out

Image
For the first time during this crash, Small Caps ($IWM) have begun to swing into a position of leadership with a breakout. The April 'bull trap' in this index has been negated, but the index now finds itself up against its 50-day MA. Despite the relative performance gain the index hasn't turned net positive in technicals with stochastics still below the bullish line.

Friday's gain Looks to Negate Thursday's Bearish Candlesticks

Image
Thursday had left bearish candlestick across the indices but Friday's gain was an attempt at least to eat into this supply. Buyers weren't able to completely negate the bearish implications of these candlesticks, but it was a good finish for bulls. The S&P has probably the best of it as it edged a close just above its 50-day MA, as On-Balance-Volume ticked back in favor of bulls. The higher close has done enough to close the breakdown gap from April and has stalled the reversal, but the swing high hasn't been challenged. 

Yesterday's Losses Reversed But Gaps Remain

Image
Bulls tried to reverse Tuesday's losses but weren't able to close the breakdown gaps. The topping patterns still look valid despite today's gains. To add to this, buying volume was well down on yesterday's selling. Lead indices, the Nasdaq and S&P, remain technically net positive. However, it's hard to be a buyer here.

Sellers Begin The Squeeze

Image
The opening gaps lower could have evolved into something worse but indices did well to stay close to their open price, even managing an intraday rally, but not enough to make new highs. Again, the index to watch is the Russell 2000; today's inverse hammer would normally be considered a reverse candlestick, but as it didn't occur at a swing high its significance is reduced. However, we have an index which is lurking near breakout support and looking vulnerable. On the good news front, selling volume was light.

Rallies to Run Into Challenges This Week

Image
It has been relatively easy climb for indices with March capitulation volume now in the 'green' (i.e. anyone who bought stock in March will now be sitting on profit). The question for these buyers is if they will continue to hold as markets approach the point of the first bounce in February (which feels like a long time ago now), and those buyers may now look at a chance to exit at breakeven. If sellers take control, how much resistance will March buyers put up not to take their profits? For the S&P I have drawn in the resistance line where I expect things to get sticky for bulls. Volume climbed to register as accumulation, so there is still a good deal of momentum near to this resistance - maybe it won't be a problem?

'Bull Trap' Reversal in Russell 2000

Image
A mixed bag of action for the Russell 2000 as bears create a 'bull trap island reversal' on the break - and subsequent move below $118. It was a move which ran contrary to what's happening in the S&P and Nasdaq.

Archive

Show more