Posts

Still grasping for a swing low

Image
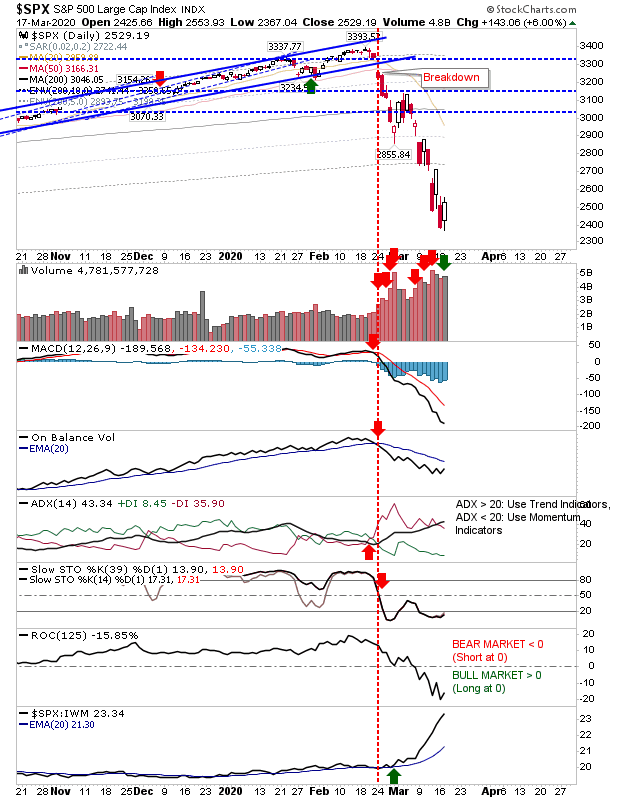
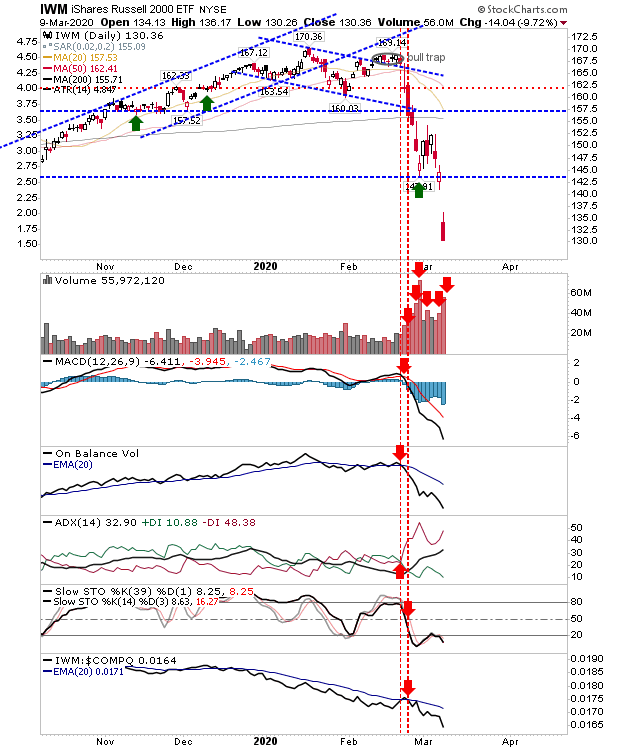
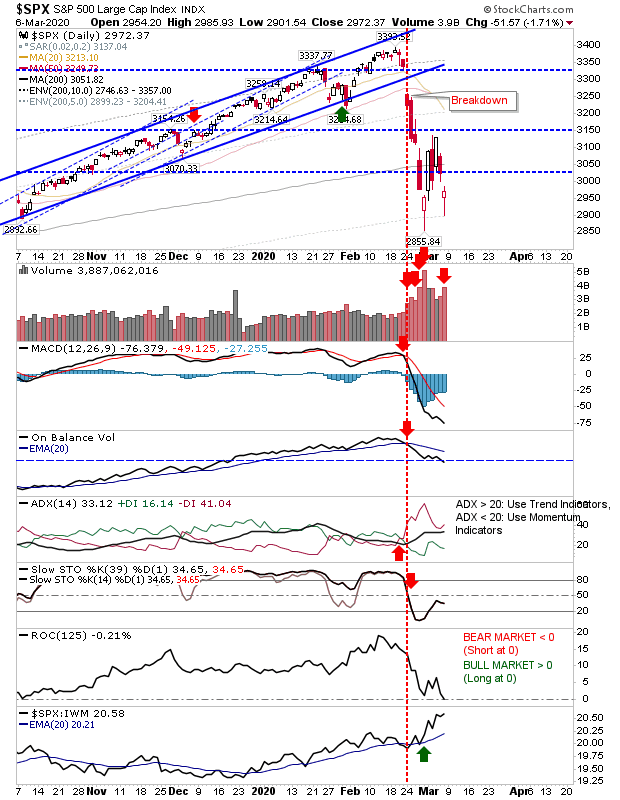
Markets continued their downward leg in an attempt to an establish a low. For example, the Russell 2000 has already given up 35% from its highs and today's candlestick didn't suggest a capitulation (it looked better on Friday). For many of the indices there are no developing divergences to work with and there hasn't been any semblance of a bounce to establish a sideways consolidation of losses, so we are still looking for a swing low to work off. The S&P did register as an accumulation day and managed a reversal of yesterday's losses, but aside of that there wasn't much more to say.  The S&P has comfortably surpassed the 5% zone of historic weak action, but to hit the 1% zone would require a tag of 2,223.

Markets Bounce (Again) in Wide Range Day

Image
It has been so long since we have made trading days like the ones we have had the past couple of weeks. Friday was no exception as markets posted 6-9% day gains following comparable losses the day before. One only has to look at the price congestion from earlier in the year and the latter part of 2019 to see how weeks worth of action is now playing out in the course of one day. Nobody knows to what extent Covid 19 will hit this year's earnings, or what the long term effects on consumer demand, supply chain security, and the gig economy will be, but as an acute infection with a relatively low mortality rate (thankfully, this is not Ebola), the recovery should work through quick enough. Aside from the morbidity factors of the disease, the impacts on loss of earnings for gig economy workers will be significant and it will be interesting to see what (if any?) changes are made in the employment conditions for such workers and other vulnerable employees in scenarios like these.  And much

True Trump Dump

Image
While Presidents typically have little influence in the direct moves in the market - today's loss was pretty much all his. Instead of inspiring some level of confidence, markets spun off in the other direction.  For the Russell 2000, this means in the space of a few weeks the index has plunged to a level last see in June 2017. The damage in the S&P and Nasdaq was not as bad, although still not great, but their respective 2018 lows are still intact. The S&P is currently 18% below its 200-day MA and has pushed into the 5% zone of historic weak price action, last seen in December 2018.  The Russell 2000 is now 27.8% below its 200-day MA, which is well beyond the 1% zone of historic weak action since 1987 (21% below its 200-day MA); while this market may slink or continue to crash lower, we are likely close to a swing low - certainly investors should be fishing for opportunities in Small Caps. The Nasdaq is the most 'resilient' of the indices but now finds itself 14%

The Ideal Long Term Investors Market

Image
Markets are still working through their declines as they seek a point of seller's exhaustion. The Russell 2000, as the index of speculative stocks, is the one to watch for leads. Today's 6%+ loss undercut the prior low and left the index grasping for a low. On the plus side, selling volume was lighter than yesterday's buying volume and the index is now 19% away from its 200-day MA; if it gets to 21% - which could happen tomorrow - it would leave it in the 1% zone of historic weak action and should be considered an incredible buying opportunity for investors with a multi-year time frame; even now, it has already surpassed the 5% zone, and investors should be active accumulating Small Cap stocks. Short term traders may also reap benefits if they have the stomach for the volatility.

Russell 2000 loses nearly 10%

Image
Another big hit to markets spent markets spinning lower. The Russell 2000 took the worst of it with a 9.7% loss, closing at the low of the day on higher volume distribution. The loss has been so strong and so quick it has moved down to the 5% zone of historically weak action dating back to 1987; this is a 'buy' zone opportunity, although I would like to see some stability in price action before confirming this as swing low. However, if you are investor with a long term window, now is a time to be building up a position.

Now the test begins...

Image
The bounce has stalled and now it's a question as to whether the swing low from February is one to be defended, or is simply a swing low in a measured move lower; a move which could see 2018 lows tested - although this would be a big stretch and a likely 'worse case' scenario. Again, just to reiterate, the 2009 low is a generational (55 year+) low and the rally which emerged is one which will see long (long) term gains. This is a sharp move down, but it won't last. Markets may move sideways for an extended period, which will 'feel bad' but is ideal for those looking to accumulate a position over time - such as in a pension or 401K. With that in mind, we have to deal with the present. The Coronavirus is here to stay (where are the anti-Vaxxers now...). We have a Chinese economy which is still trying to come to terms with the infection and the eventual economic fall out. We have a UK and US economy led by the most incompetent group of 'leaders' for whom

Bounce continues

Image
Yesterday's return to selling had the look of a tiring bounce, but this was swiftly undone by today's buying. Market rallies are still in play with 20-day and 50-day MAs as overhead resistance. The S&P rally is aiming towards converged 20-day and 50-day MAs, although buying volume is lighter than recent selling. Technicals are all net bearish, not surprisingly, so we will be looking for bullish divergences when traders eventually return to selling

Archive

Show more