Posts

Sellers Double Down

Image
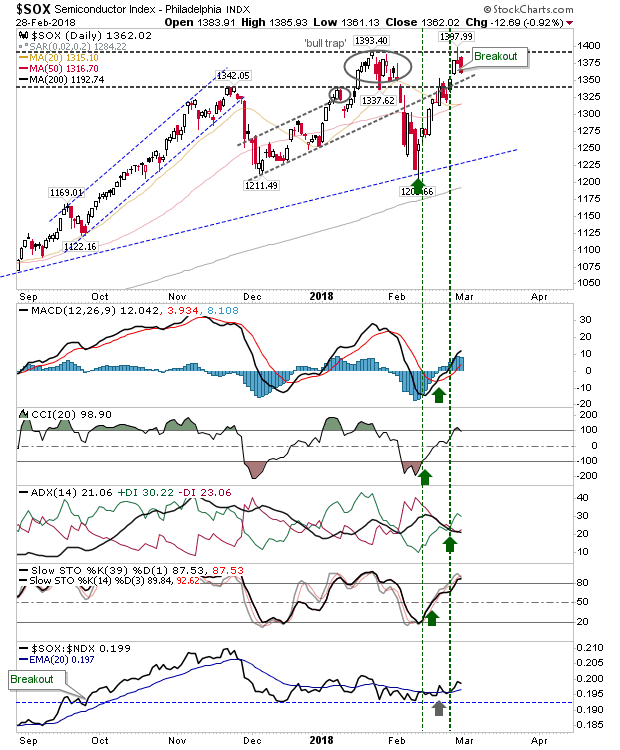
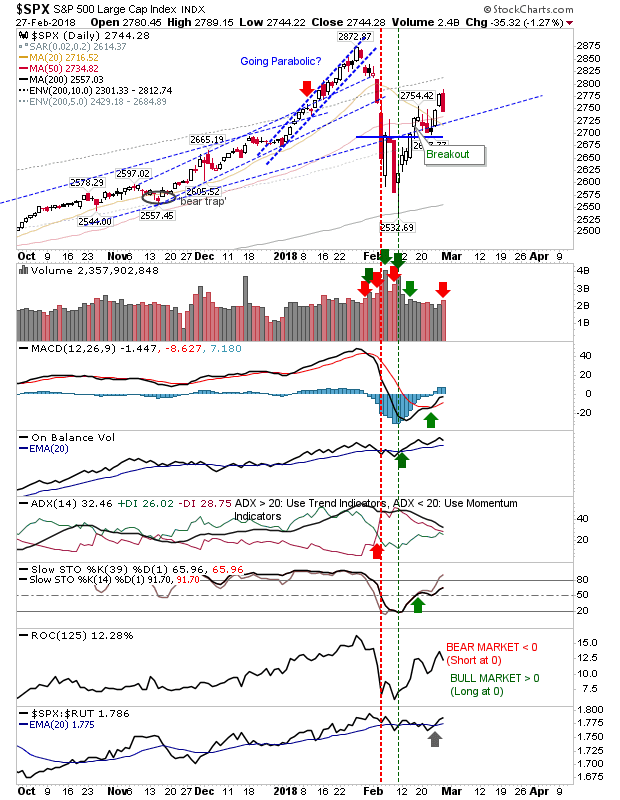
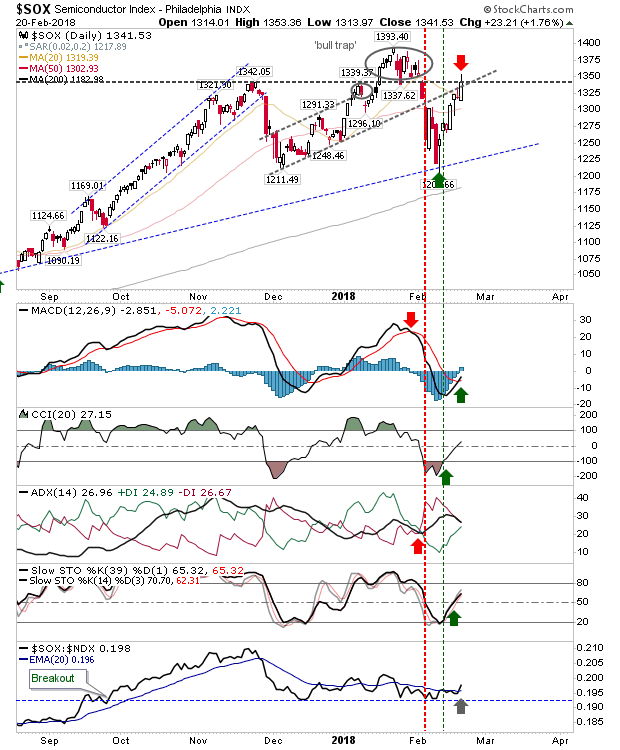
Yesterday established a round of profit-taking after Monday's breakouts had suggested something more positive in the works. Unfortunately, another round of selling ranking as higher volume distribution left indices in a more precarious state. The Semiconductor Index had come close to tagging 1,400 but the index looks to have confirmed a bearish 'evening' star as part of a double top. A drop below 1,340 would send bulls running to the hills and open up tests of the slower rising channel and 200-day MA.

Fresh Distribution

Image
Yesterday saw sellers return with a fresh round of higher volume selling. However, the breakout moves which saw indices clear the congestion of spike highs from last week were not violated so Tuesday's action will not as yet panicked existing longs or buyers of the February swing low to sell just yet. The only exception to this is the Russell 2000 which is struggling to achieve any kind of market leadership. Technicals for the S&P are generally bullish with the index still outperforming the Russell 2000 and the ADX just a small step away from a bullish cross which would be enough to confirm a net bullish picture on the intermediate time frame (i.e. suggesting this rally could go on for another few months).

Last Week's Weakness is No More

Image
It was looking to be a struggle after last week's series of 'inverse hammers' had set up what looked like swing highs for indices but these have been cleared by today's gains. In the process of doing so the S&P closed above the 20-day MA with 'buy' signals in the MACD, On-Balance-Volume and Stochastics. Only relative performance is underperforming.

Markets close week near weekly highs

Image
Markets delivered a strong end-of-week close which for many meant a close near spike highs. The strongest finish of the week was delivered by the Nasdaq 100 - it posted a new high as it builds a challenge on the January 'bull trap'. Volume climbed to register an accumulation day. If bulls are in control then the Nasdaq 100 should see some follow through higher; note the strong relative performance against the Russell 2000.

'Bull Trap' in Dow Jones Industrial Average

Image
Starting to see evidence that the February bounce in markets is fading. The Dow Jones Industrial Average finished with a 'bull trap' as it ducked below breakout support despite finishing above yesterday's close. Volume dropped as relative performance against tech indices took a marked step lower. Troubling times for the 'flight-to-safety' route.

Sellers Come In But Semiconductors Gain

Image
Markets were set up for sellers with most indices experiencing broad selling. However, the one index which looked set up best for shorts - the Semiconductor Index - actually managed to gain.  Anyone taking up Friday's short in the latter Index will have been stopped out but another shorting opportunity may have presented itself. Technicals haven't returned to becoming net bullish but only the ADX remains to shift.

Rallies Slow As Semiconductors Tag Resistance

Image
Friday saw the indices close near the lows of the day as Semiconductors tagged resistance and its 20-day MA. Supporting technicals offered a mix of bullish and bearish markets but shorts have their opportunity with a stop above 1,334. The S&P edged a close above the bullish mid-line in stochastics along with a 'buy' in On-Balance-Volume. However, the index also experienced a relative loss against Small Caps as it struggles to attract new buyers. The Russell 2000 pushed across the bullish mid-line and is close to a new MACD 'buy' trigger. While the Russell 2000 is outperforming against the S&P it's underperforming against the Nasdaq. However, a push above the 20-day MA may be enough for it to regain overall leadership. The Nasdaq may be the relative market leader but Tech indices closed lower where Large and Small Caps finished higher. A loss tomorrow will kick off the potential development of a new downward channel; marking a continued expansi

Archive

Show more