Posts

Bearish Wedge in Russell 2000?

Image
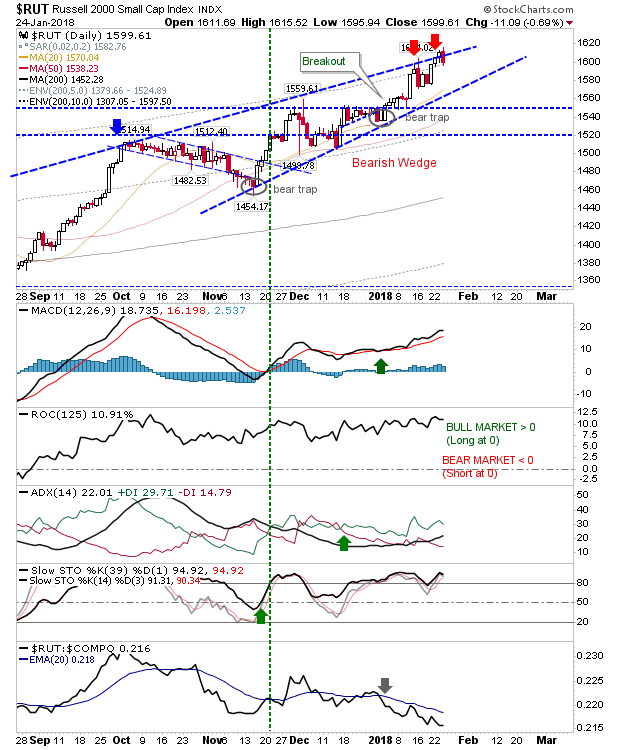
It's a bit of a grasp given strength across markets but the Russell 2000 may be shaping a bearish wedge. There are three tags of resistance but it's rising support anchored by the two 'bear traps' which suggests a possible wedge. Today's bearish engulfing pattern also contributes.

Nasdaq Hits 15% Historic Price Action Highs as S&P Enters 10% Extreme Zone

Image
The Nasdaq joined the S&P at historic highs as it hit the 15% zone of historic price extremes (relative to its 200-day MA). The S&P went a step higher as it touched the 10% zone of historic highs; i.e. it trades at levels above 90% of historic price action dating back to 1950 - a sign there isn't much left to this rally. If it makes it to 2,874 it will be in the 5% zone, a zone last seen in February 2011.

S&P Keeps Marching Higher

Image
Last week saw the S&P hit the 15% of historic price action where it has been 10.7% or higher above its 200-day MA since 1950.  As of Friday, it's only 0.3% away from hitting the 10% of historic price action; i.e. over the last 68 years the S&P, 90% of historic action has been lower than where the index sits as of Friday's close - i.e. heavily overbought. This is time to be taking profits and/or selling covered calls on existing positions. Volume climbed to register accumulation as other supporting technicals give no indication of potential weakness - so those waiting for more upside don't have much to suggest this won't happen.

Short Covering Driving Gains in Semiconductors and Nasdaq 100

Image
The Nasdaq 100 breakout cleared channel resistance, the fifth significant breakout in four months. All technicals are posting new near-term highs which also meant the short generated on the tag of the rising channel is negated.

Archive

Show more