Posts

Russell 2000 Tags Resistance As S&P Breaks (Again!)

Image
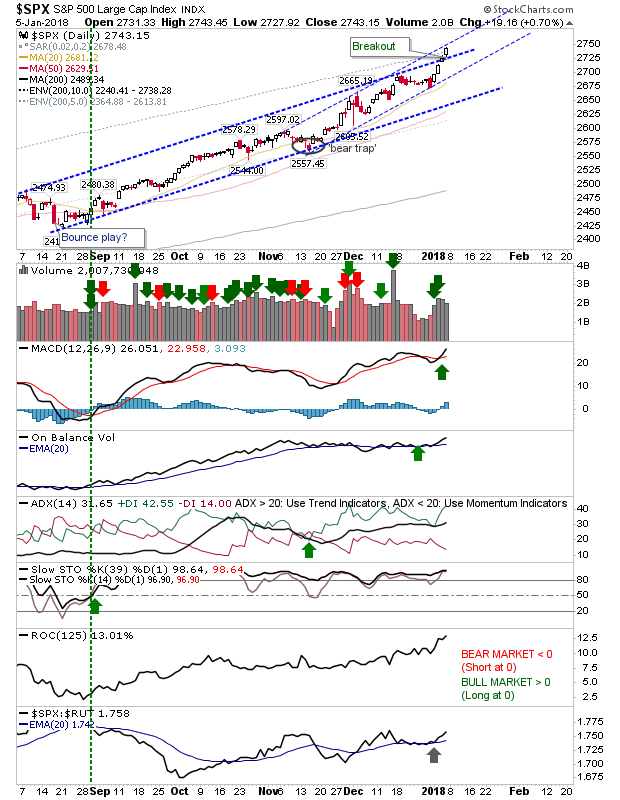
I forgot to mention last week that the S&P has reached the "15% of Profit Take" zone of historical price action relative to the 200-day MA dating back to 1950. If it reaches 1,653 it will be in the 5% percentile of historic action - a 'strong sell' signal.  The price tag came with a fresh breakout from the channel; the second breakout in 2018.

Another Acceleration in the Rally

Image
Another day of gains pushed Indices to new highs and offered a breakout from the accelerated channel for the Nasdaq but it was the Russell 2000 which took the biscuit. The Russell 2000 added nearly 2% as buyers swooped in to take advantage of recent quiet action.  This follow on to the recent breakout sits the index up nicely for further gains.

Channel Resistance Tags for S&P, Nasdaq and Nasdaq 100

Image
Since redrawing channel resistance the S&P, Nasdaq and Nasdaq 100 now find themselves up against (accelerated) channel resistance. This may be viewed as an opportunity to take (partial) profits and/or sell covered calls.  Buying volume for the S&P was modest and technicals remain strong but some pause in the buying would look preferable at this point.

S&P Breaks out of Channel

Image
The S&P broke upside from one channel to leave it another. This is the third such acceleration in the last six months, leaving the index prone to a parabolic (if not profitable) run. Buying volume was low, but technical strength is good.

Archive

Show more