Posts

Friday's Action Overshadowed By Thursday's Buying

Image
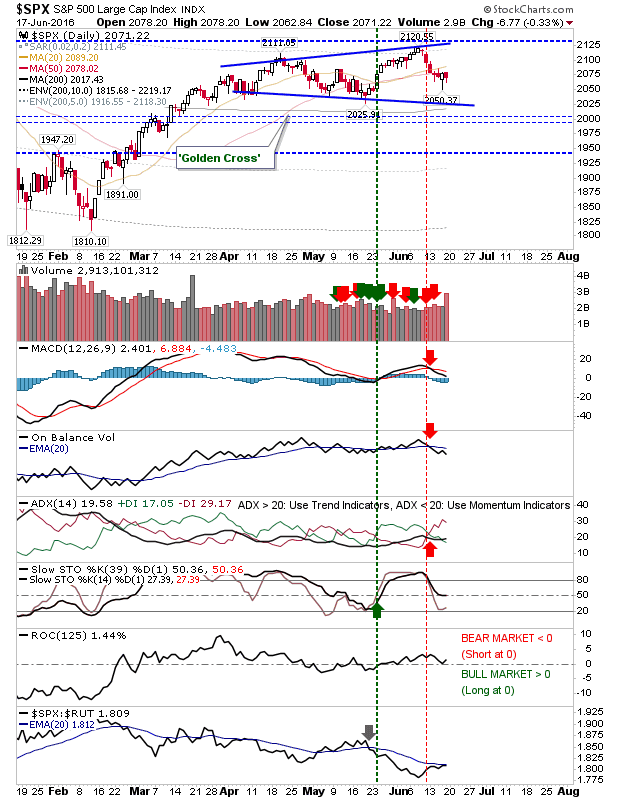
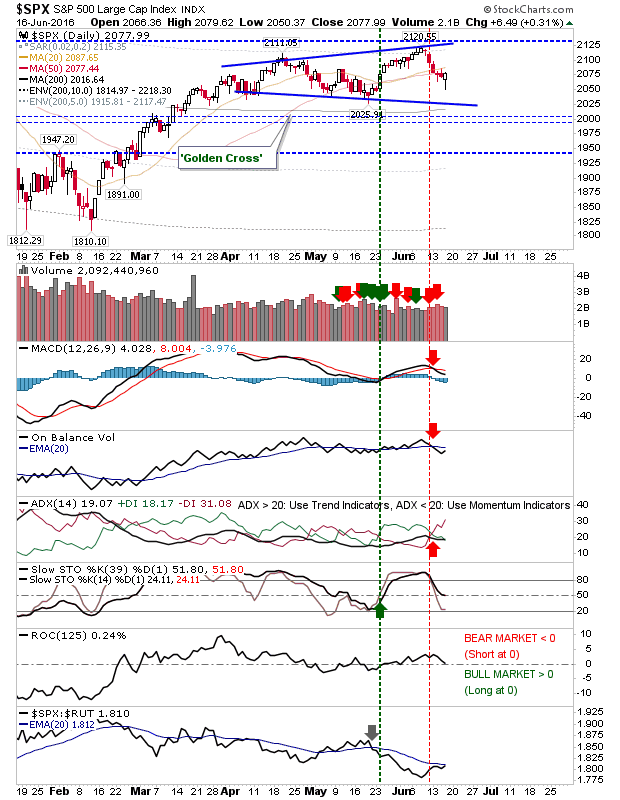
Bears returned on Friday, but weren't able to undo the action of bulls from Thursday. Volume did climb, registering as distribution, but Thursday's lows held. The S&P turned net bearish with stochastics [39,1] crossing below the mid-line. While relative strength (to the Russell 2000) improved.

Bullish Riposte Delivered

Image
This was the perfect day for bulls. Early selling had squeezed any weak holders out of their positions and sucked shorts in, only for the late recovery to have forced newly minted shorts to cover and encouraged new buyers to come in at lows. What's needed next are solid white candlesticks on Friday to confirm a swing low. The S&P remained below converged 20-day and 50-day MAs, but a good day tomorrow should easily regain these moving averages as support. Technicals haven't all turned negative, but slow stochastics are hanging on.

Bears Reverse Early Gains

Image
On my weekly post I had talked about the bearish position , which wasn't really apparent on the daily charts. Today was the first indication bears may be working on something more than what had looked to be a straightforward 'buy the dip' retracement. The Dow was the first index to return to a net bearish technical picture on the daily time frame. Volume was lighter than recent days, which will offer some comfort to bulls, but it's the manner of the weak finish which is of greater concern.  The 200-day MA is looking like a key support level.

Neutral Day For Markets

Image
Today's action saw bears attempt another day of selling, but buyers were able to recover markets by the close of business. Volume climbed to register as distribution, but the end-of-day recovery softened the blow.  Tomorrow is a chance for bulls to arrest what has been a sequence of down days. The S&P finished below the 50-day MA with technicals all net bearish. The 'doji' candlestick is a positive and a stop below today's lows offers a chance for bulls looking for a trade low.

Where Next? Bears Have a Case

Image
The Short Term picture has been favoring bulls with indices knocking at new all-time highs. However, the Long Term picture hasn't really improved to the same degree. This chart of the relationship between Consumer Discretionary and Staples ETF, which J.C. Parets had shown in the past, has taken another turn in favor of bears. With the S&P at new highs, the ratio between Discretionary and Staples is about to post a new swing low to levels last seen in 2013. Should these losses accelerate it could lead to market declines last seen in 2000 and 2008. If this occurs, the media may pin it on Brexit/Trump/Kittens, but in the battle between supply and demand, supply could be in the ascendancy.

Low Volume Activity

Image
With today belonging to sellers - just - it was good to see it accompanied with low volume and very little net change in price.  Today was the perfect riposte to recent gains and shows the lack of interest for shorts to act or for longs to sell. The S&P is knocking on the door of 2,125.

Russell 2000 adds to Gains

Image
Another good day for indices. All continued to gain ground as new all-time highs become closer to reality. The Russell 2000 continued to pull away as the May rally picked up steam. After a period of extended weakness it has managed to push a positive Rate-of-Change - the one indicator which had been strongly bearish until this week.  Relative performance added to its new swing high too.

Archive

Show more