Posts

S&P Waits Another Day

Image
After the breakout in the Russell 2000 it had looked like the S&P was ready to follow suit, but Friday wasn't to be its day. The S&P experienced a relatively light point loss, but did register a distribution day. However, it remains primed for a breakout on Monday.

Briefly...

Image
My internet connection is real slow at the moment, so it's taken twice as long to do anything. As a result, I don't have time to take a look at the charts. One chart I am watching closely is the Percentage of Nasdaq Stocks above the 50-day MA. Today saw a net bullish return for technicals, but bulls need this to hold above 50% to suggest they are in control.

Pause Prior to Resistance Challenge

Image
With the swings we have seen since the New Year rolled in, it was no surprise to see small losses today after two good days. This leaves indices nicely positioned to break out of the various trading ranges in play. The S&P has to get past what looks to be strong resistance around 2,064 before it can make a challenge on 2,093. The former might prove to be the bigger challenge than the latter. Technicals are a little mixed, with On-Balance-Volume whipsawing back to a 'sell' trigger.

Range Trading Continues

Image
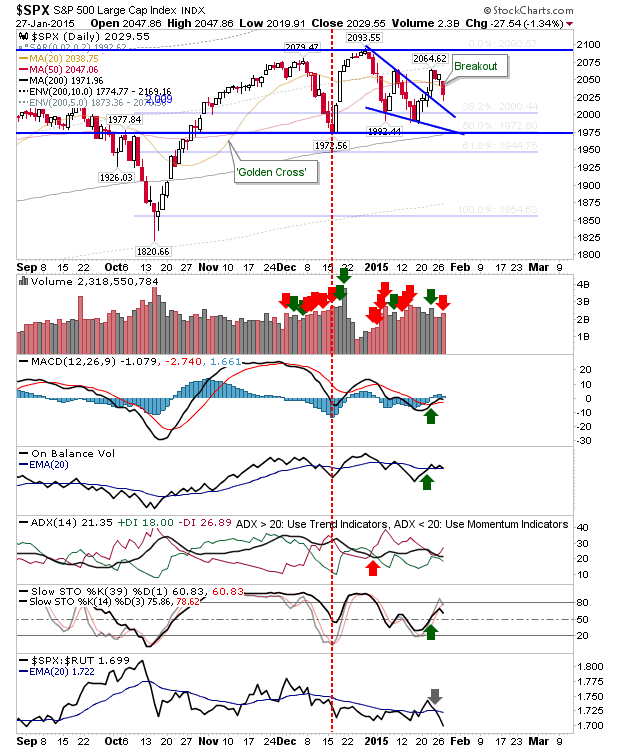
Very little for the investor, and a market offering high whipsaw risk for intraday traders. All lead indices continue their range bound behaviour, caught more or less in the middle of those ranges. Very little to get excited about until either support or resistance break. The S&P had looked like it was attempting to build a head-and-shoulder reversal within the base, but this now appears to be trading flat out of that pattern, and more towards a base-within-base. A couple of positives are the 'buy' signals in the MACD and On-Balance-Volume, which may favour a push above 2,064 and a challenge of 2,090s. Also, yesterday's gain registered as an accumulation day. While some slowing of the advance on a tag of 2,064 is possible, there is good grounding for some more upside.

Next Post Tuesday

Image
Away for the weekend, so next post will be Tuesday. In the meantime, check out   Douglas' and Jani's  blog. --- Accepting KIVA gift certificates to help support the work on this blog. All certificates gifted are converted into loans for those who need the help more. Follow Me on Twitter Dr. Declan Fallon is the Senior Market Technician and Community Director for Zignals.com , and Product Development Manager for ActivateClients.com . You can read what others are saying about Zignals on Investimonials.com . JOIN ZIGNALS TODAY - IT'S FREE!

Bearish Engulfing Patterns

Image
Today's end-of-day losses were disguised by the relatively light declines at the close. Markets opened strong, but were unable to maintain premarket strength. The consolidations in place since the 'Santa Rally' are holding on, but markets can ill afford additional losses from here. The S&P finished on the 38.2% Fib retracement of the 'Santa Rally'. Aggressive longs may view this as a head-and-shoulder reversal; if this pr-oves to be the case then markets have to rally from the cash open. The S&P is a case in point.

Sharp Reversals on Economic News

Image
It has been a while since something other than Central Banks have moved the market. This time, it was the turn of old fashioned Durable Goods to upset the party. The loss was big, but it's still noise within the bounds of the 'Santa Rally'.  Consolidation breakouts remain in play, although volume climbed to register distribution. The S&P crossed below its 50-day MA, but it's a flatlined moving average. Technicals are mixed.

Archive

Show more